- Who We Serve
- What We Do
- About Us
- Insights & Research
- Who We Serve
- What We Do
- About Us
- Insights & Research
How Stocks Historically Performed During Fed Rate Cut Cycles
Our research shows that on average U.S. stocks performed well a year after the start of a Federal Reserve rate cut cycle.
- Markets & Economy
- Equity Insights
- Active Equity
- Federal Reserve
Key Points
What this is
We analyze the performance and volatility of U.S. equities and factors before and after the start of Fed rate cuts since 1980.
Why it matters
As economic uncertainty looms, investors want to understand how the Fed’s September 18 rate cut will impact equity performance in the coming year.
Where it's going
Historically, U.S. equity typically performed well in the year following the start of Fed rate cut cycles, though volatility has risen.
The Federal Reserve’s rate cut on September 18 likely represents the first in a series of rate cuts as the Fed balances their dual mandate around employment and price stability. Each rate cut cycle is unique in its own way, and this one follows a rate hiking cycle totaling 5.25% from March 2022 through July 2023 aimed at bring inflation down towards the Fed’s 2% target. Despite this tightening, the economy has remained resilient with expectations for lower but still positive growth.
Overall, we believe the balance of economic data remains constructive and supportive of a soft landing scenario. However, uncertainty tends to be higher at these policy inflection points as investors weigh divergent outcomes. With this in mind, what can history tell us about the past performance of markets during rate cut cycles?
Historical U.S. Equity Performance After the First Rate Cut
Given rate cut cycles typically commence to stimulate economic activity in a slowing economy, investors may be cautious about stock returns during this timeframe.
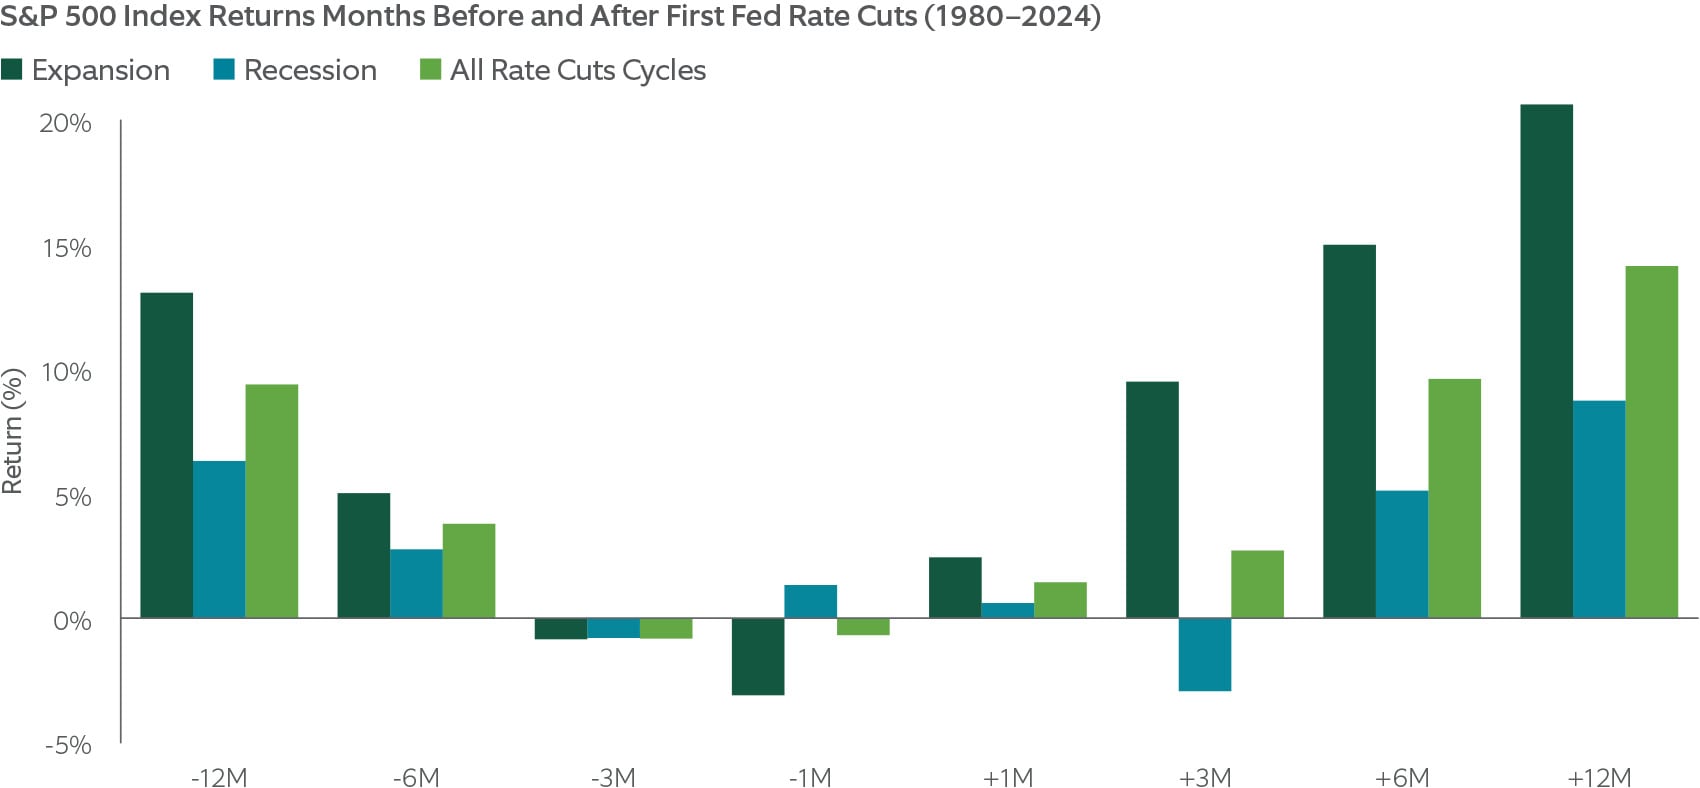
However, looking at the history may provide comfort. However Since 1980, there have been a total of 11 rate cut cycles. In the 12 months following the start of a rate cut cycle, equity returns as measured by the averaged 14.1%. Stocks also rose on average over three months and six months after the first rate cut.
How much does it matter whether the economy enters a recession or not after the first rate cut? Exhibit 1 shows these historical scenarios. When the economy avoided recession and expanded, the S&P 500 Index returned an average 20.6% a year after the first rate cut of the cycle and performed positively in all cases. Not surprisingly, returns were somewhat lackluster amid recession in both the 12 months prior to and following a rate cut. Although hard landings were associated with steep drawdowns that sometimes occurred outside of the rolling one-year window, equities still performed positively a year after on average during recession, and in three of the six recession scenarios.
The index, a gauge of the large-cap U.S. equity market, includes 500 companies that represent approximately 80% of the market capitalization of publicly traded U.S. equities.
EXHIBIT 1: POSITIVE HISTORICAL RETURNS AFTER FIRST RATE CUT
After the Fed’s first rate cut historically since 1980, the S&P 500 Index on average had positive returns, with stronger returns associated with expansion scenarios.

Sources: Northern Trust, S&P-Dow Jones, NBER. From 12/31/1979 through 7/31/2024. Past performance does not guarantee future results. Recessionary rate cycles are where a recession, as defined by NBER, occurred during or shortly following the rate cut cycle. Index performance returns do not reflect any management fees, transaction costs or expenses. It is not possible to invest directly in any index.
Expect a Bumpy Ride
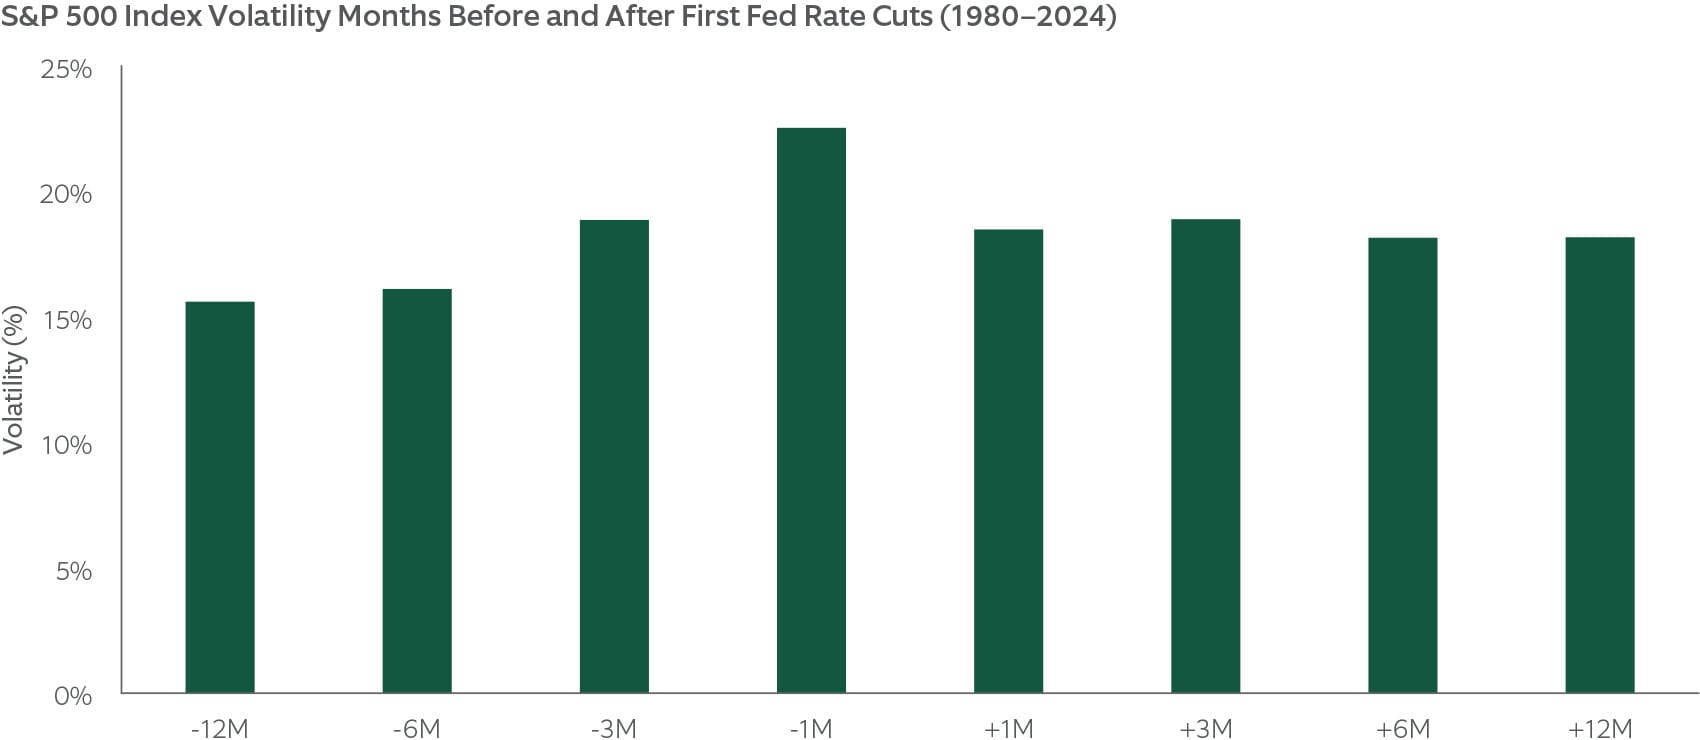
Also notable is what happens to volatility entering and during a rate cut cycle. Exhibit 2 shows that, historically, stock volatility was above average in the three months before the first rate cut of the cycle and stayed elevated over the year that followed. For example, in the one month prior to the first rate cut, volatility was 22.5% versus average market volatility of around 15%. Although the volatility lessened over time, it still remained above average a year later, highlighting that rate cut cycles are associated with more uncertainty.
In 2024, markets have played right along with this historical script. Stock volatility was subdued the first half of this year. But leading up to the September 18 rate cut, volatility picked up significantly, as equity markets sold off to start both August and September. Markets recovered in both instances, but volatility remains above the first half of the year.
EXHIBIT 2: HISTORICALLY HIGHER VOLATILITY INTO AND FOLLOWING THE FIRST RATE CUT
Historically, volatility started picking up three months before the first rate cut of the cycles and remained elevated even a year after.

Sources: Northern Trust, S&P-Dow Jones. From 12/31/1979 through 7/31/2024. Past performance does not guarantee future results. Index performance returns do not reflect any management fees, transaction costs or expenses. It is not possible to invest directly in any index.
What About Equity Factors?
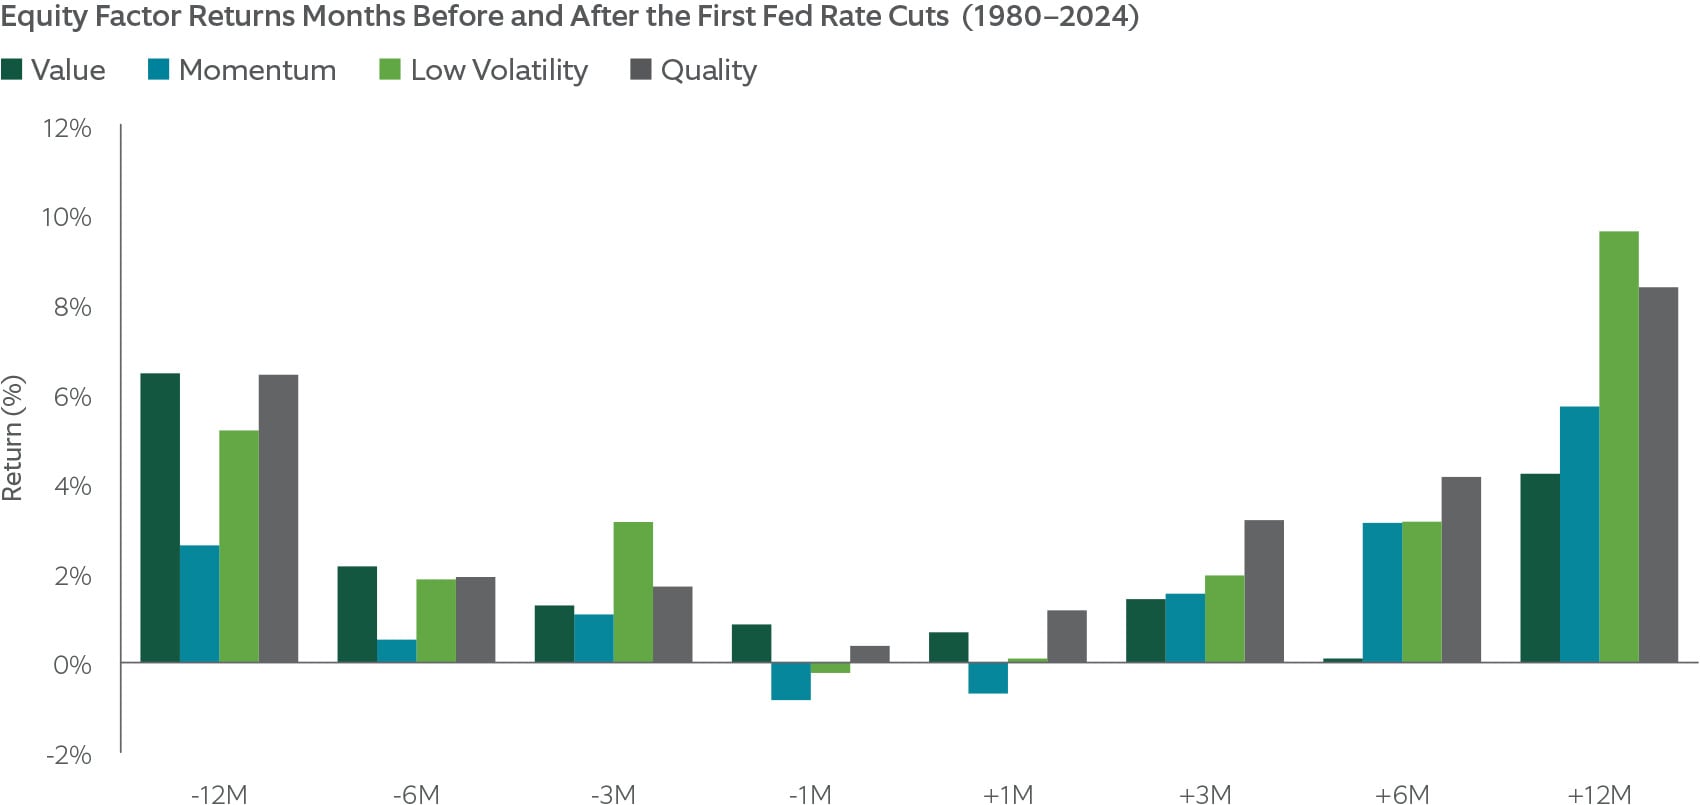
We also examined how equity market factors (, , , ) performed historically over rate cut cycles. As shown in Exhibit 3, the average returns to each factor were positive in the 12 months prior and following the first rate cut. The factor returns during these periods were generally in line with longer run averages. Of note, the quality factor performed most consistently of the factors during the rate cut cycle, which we see in other studies of economic scenarios1 as well.
Other factors, although positive overall, exhibited variability over these periods, which is not surprising given the heightened level of volatility and divergent outcomes depending on whether the economy is in expansion or recession. For example, during the 1998 rate cut cycle, the dot-com bubble continued inflating to the detriment of low volatility stocks, which underperformed significantly. However, following the dot-com peak in March 2000 and the early 2001 rate cut cycle, low volatility stocks significantly outperformed their high volatility counterparts. This is an important reminder that although we are looking at averages, each rate cut cycle had a unique set of circumstances.
The value factor targets companies that trade at a low price relative to a fundamental measure.
This factor targets companies with efficient management, profitability, and strong cash flows. Quality strategies seek to provide excess returns by investing in companies that are better positioned for short and long term growth.
The low volatility factor targets companies with less volatile cash flows. Low volatility strategies seek to provide excess returns by minimizing losses in market downturns while participating in rising equity markets.
The momentum factor targets companies that have strong market sentiment and analyst sentiment.
EXHIBIT 3: HISTORICAL EQUITY FACTOR PERFORMANCE NEARLY ALL POSITIVE AFTER RATE CUT
The value, momentum, low volatility, and quality factors performed positively on average in three months, six months, and a year after the first rate cuts.

Sources: Northern Trust, S&P-Dow Jones, NBER. From 12/31/1979 through 7/31/2024. Factor returns represent Northern Trust factor definitions and are monthly rebalanced, long-short, equal-weighted portfolios that go long the highest factor quintile and short the lowest factor quintile. Low Volatility factor from 12/31/1983 through 7/31/2024. Past performance does not guarantee future results. Index performance returns do not reflect any management fees, transaction costs or expenses. It is not possible to invest directly in any index.
What Can We Expect?
Historically, equity markets have typically performed well in the year prior to and following the start of Fed rate cut cycles. The has not surprisingly been conditioned on whether a recession occurred or not. We see a soft landing for the economy as our base case, with second quarter economic growth of 3%, strong U.S. corporate earnings, and slowing inflation balanced against a softening labor market. Historically speaking, this scenario has been constructive for equities. However, volatility has tended to become and remain elevated around rate cut cycles, meaning investors should expect a bumpy ride.
We also provided a look at the historical performance of factors, which were generally positive during these periods, noting the uniqueness of each rate cut cycle and the dispersion of performance. Although past performance is no guarantee for future success, we hope these results provide some perspective into equity return dynamics as we move through a period of heightened volatility surrounding markets while investors debate economic outcomes.
1See Navigating Inflation — An Analysis of Equity Factor Performance Over 150 Years. Northern Trust White Paper (2024). See Contraction, Recovery & Growth: How Factors Performed. Northern Trust White Paper (2018).
Main Point
Generally positive performance, even in recession
Historically, equity markets have performed well on average in the year prior to and following the start of Fed rate cut cycles. The year after results have been highly dependent on economic growth, but even during recessionary outcomes, the average return was still positive one year out.

Contact Us
Interested in learning more about our expertise and how we can help?
IMPORTANT INFORMATION
Northern Trust Asset Management is composed of Northern Trust Investments, Inc., Northern Trust Global Investments Limited, Northern Trust Fund Managers (Ireland) Limited, Northern Trust Global Investments Japan, K.K., NT Global Advisors, Inc., 50 South Capital Advisors, LLC, Northern Trust Asset Management Australia Pty Ltd, and investment personnel of The Northern Trust Company of Hong Kong Limited and The Northern Trust Company.
Issued in the United Kingdom by Northern Trust Global Investments Limited, issued in the European Economic Association (“EEA”) by Northern Trust Fund Managers (Ireland) Limited, issued in Australia by Northern Trust Asset Management (Australia) Limited (ACN 648 476 019) which holds an Australian Financial Services Licence (License Number: 529895) and is regulated by the Australian Securities and Investments Commission (ASIC), and issued in Hong Kong by The Northern Trust Company of Hong Kong Limited which is regulated by the Hong Kong Securities and Futures Commission.
For Asia-Pacific (APAC) and Europe, Middle East and Africa (EMEA) markets, this information is directed to institutional, professional and wholesale clients or investors only and should not be relied upon by retail clients or investors. This information may not be edited, altered, revised, paraphrased, or otherwise modified without the prior written permission of NTAM. The information is not intended for distribution or use by any person in any jurisdiction where such distribution would be contrary to local law or regulation. NTAM may have positions in and may effect transactions in the markets, contracts and related investments different than described in this information. This information is obtained from sources believed to be reliable, its accuracy and completeness are not guaranteed, and is subject to change. Information does not constitute a recommendation of any investment strategy, is not intended as investment advice and does not take into account all the circumstances of each investor.
This information is provided for informational purposes only and is not intended to be, and should not be construed as, an offer, solicitation or recommendation with respect to any transaction and should not be treated as legal advice, investment advice or tax advice. Recipients should not rely upon this information as a substitute for obtaining specific legal or tax advice from their own professional legal or tax advisors. References to specific securities and their issuers are for illustrative purposes only and are not intended and should not be interpreted as recommendations to purchase or sell such securities. Indices and trademarks are the property of their respective owners. Information is subject to change based on market or other conditions.
All securities investing and trading activities risk the loss of capital. Each portfolio is subject to substantial risks including market risks, strategy risks, advisor risk, and risks with respect to its investment in other structures. There can be no assurance that any portfolio investment objectives will be achieved, or that any investment will achieve profits or avoid incurring substantial losses. No investment strategy or risk management technique can guarantee returns or eliminate risk in any market environment. Risk controls and models do not promise any level of performance or guarantee against loss of principal. Any discussion of risk management is intended to describe NTAM’s efforts to monitor and manage risk but does not imply low risk.
Past performance is not a guarantee of future results. Performance returns and the principal value of an investment will fluctuate. Performance returns contained herein are subject to revision by NTAM. Comparative indices shown are provided as an indication of the performance of a particular segment of the capital markets and/or alternative strategies in general. Index performance returns do not reflect any management fees, transaction costs or expenses. It is not possible to invest directly in any index. Net performance returns are reduced by investment management fees and other expenses relating to the management of the account. Gross performance returns contained herein include reinvestment of dividends and other earnings, transaction costs, and all fees and expenses other than investment management fees, unless indicated otherwise. For U.S. NTI prospects or clients, please refer to Part 2a of the Form ADV or consult an NTI representative for additional information on fees.
Forward-looking statements and assumptions are NTAM’s current estimates or expectations of future events or future results based upon proprietary research and should not be construed as an estimate or promise of results that a portfolio may achieve. Actual results could differ materially from the results indicated by this information.
Not FDIC insured | May lose value | No bank guarantee