MarketScape
- Who We Serve
- What We Do
- About Us
- Insights & Research
- Who We Serve
- What We Do
- About Us
- Insights & Research
Save to bookmark
Investment Perspective · 09.26.24
S&P 500 Earnings Breadth Broadens
Our experts explore the implications of wider S&P 500 earnings growth, potential Fed rate cuts, and the outlook for global equities and bonds amidst ongoing economic shifts.
- Portfolio Construction
- Risk Management
- Fixed Income Insights
S&P 500 Earnings Breadth Broadens
Save to bookmark
Save to bookmark
Key Points
What it is
We explore broader S&P 500 earnings growth and recent rate changes and evaluate their impact on global investment strategies.
Why it matters
Understanding recent earnings shifts and policy developments may help investors navigate shifting market conditions with greater insight.
Where it's going
The market’s reaction to expanding S&P 500 earnings suggests a cautiously optimistic outlook, underscoring potential opportunities amid rate changes and economic uncertainty.
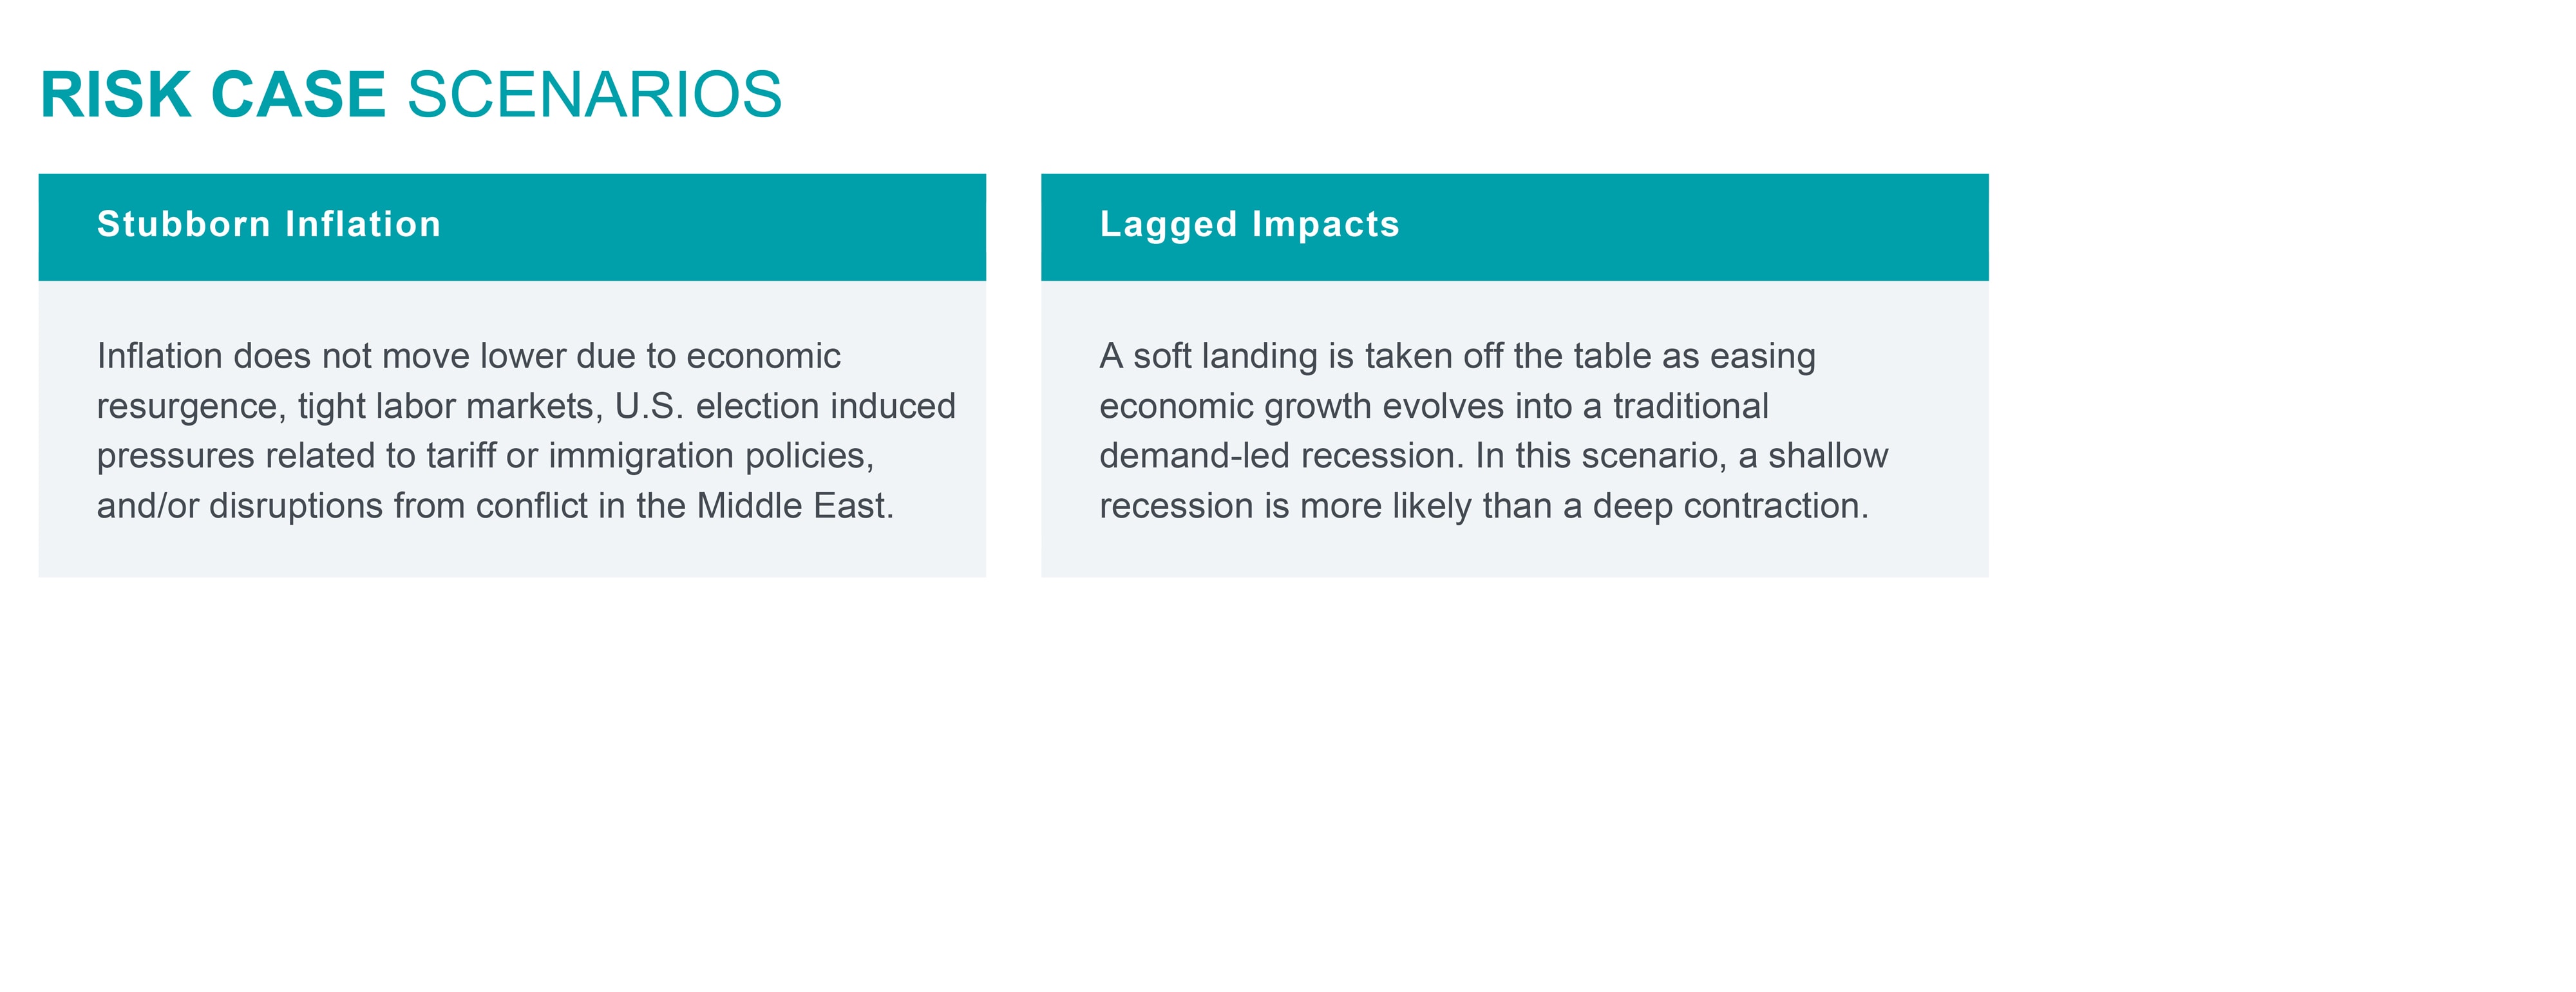
After a few volatile weeks, global equities ended up about 2.6% in August. Following a 15% plus decline in the first three days of August, Japanese equities ended the month up 1.8%. In the U.S., defensive equities performed better than the more cyclical areas and mega cap stocks. Fixed income returns have benefited from recent declines in interest rates. The 2s10s curve (yield curve) has un-inverted. The 2-year Treasury yield declined as the market began anticipating interest rate cuts over the next 12 months. Credit spreads widened somewhat, but it mostly reflected heightened volatility in the rates market and less about the health of the corporate sector.
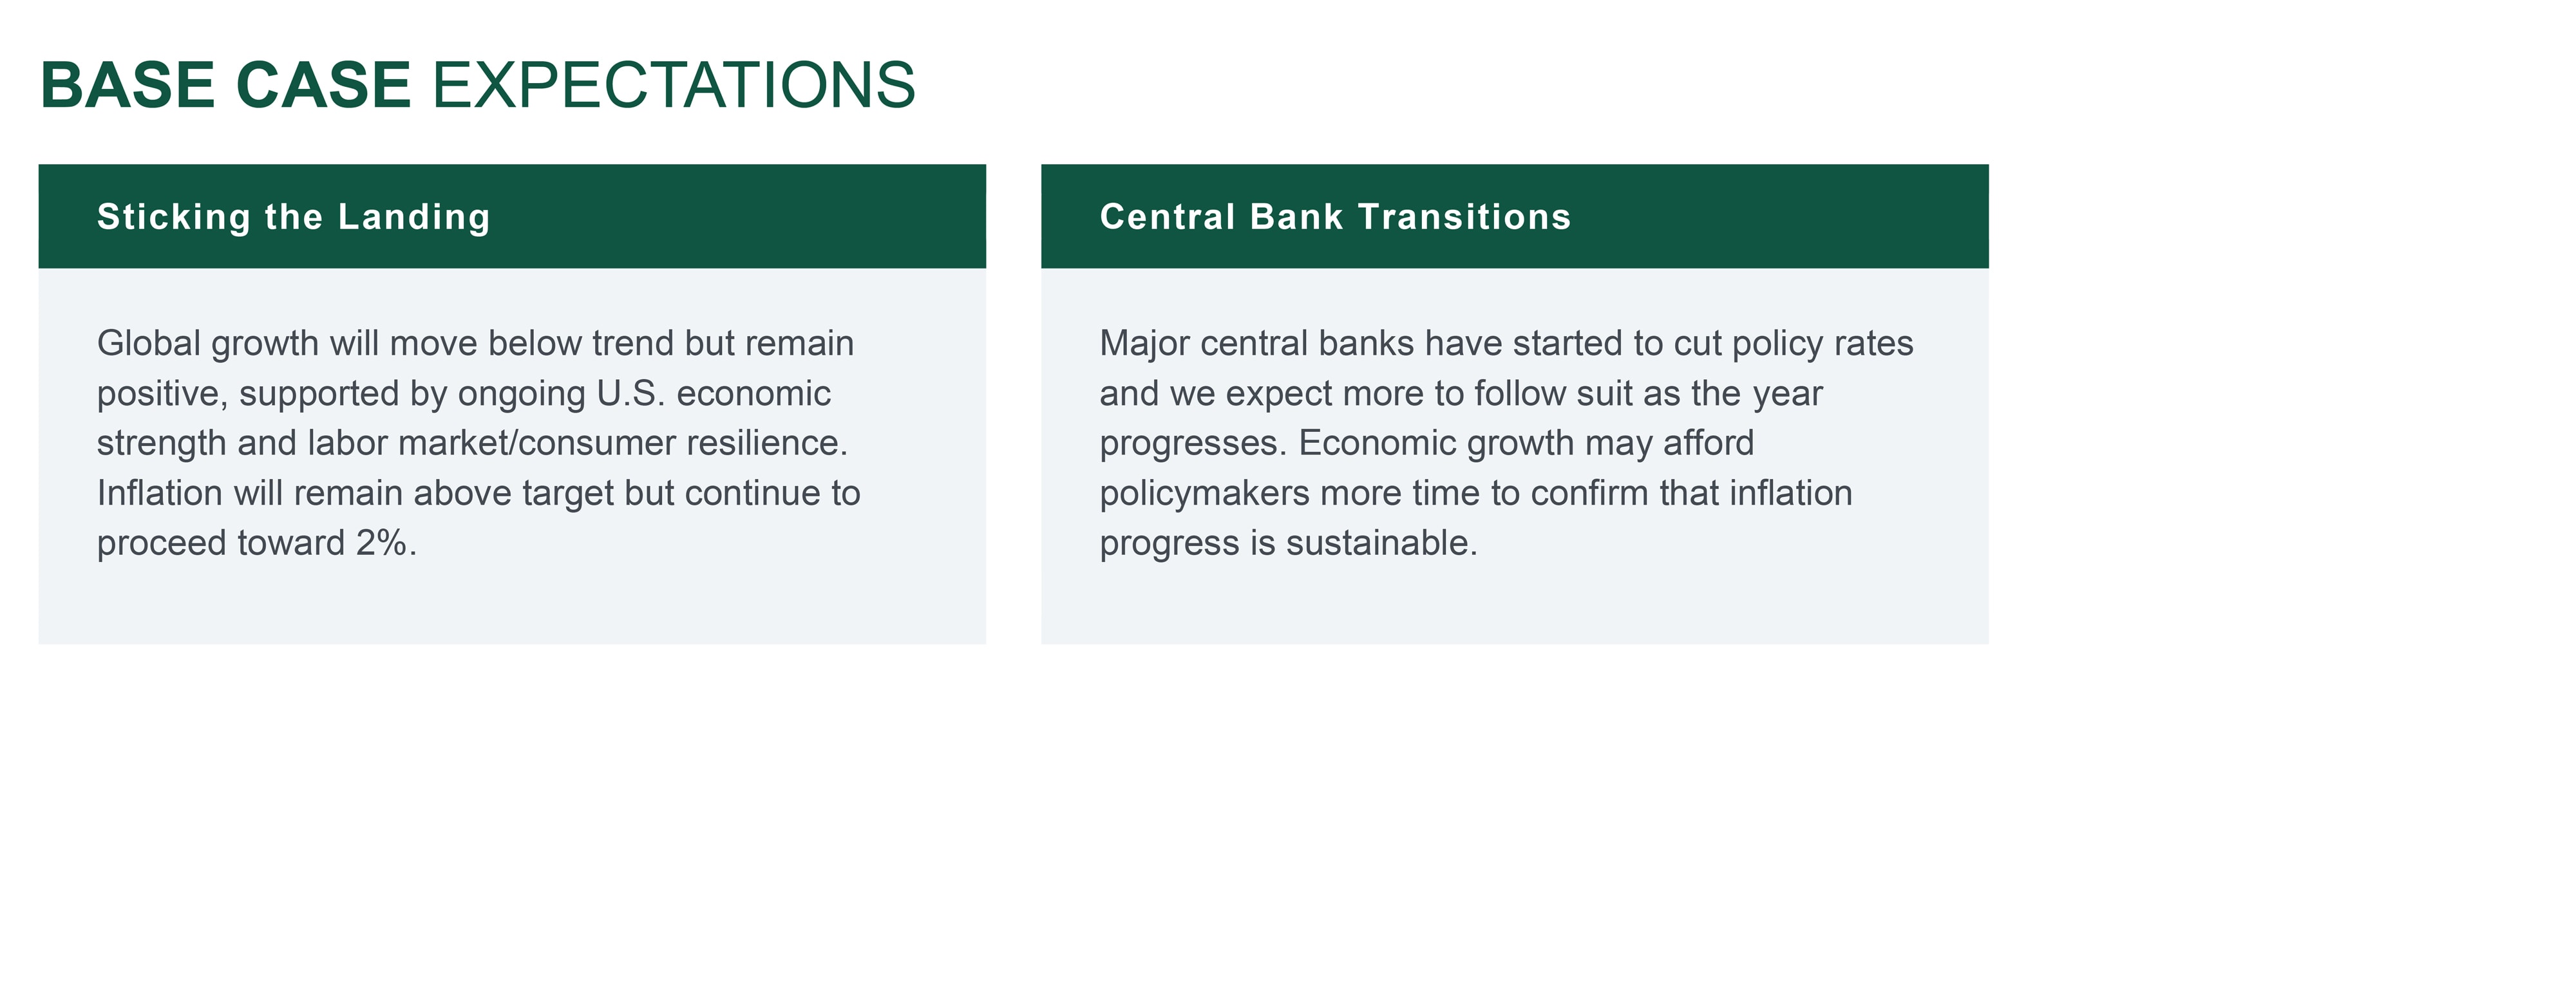
U.S. economic activity is likely to cool from its brisk pace in the first half, but we don’t expect a contraction in the near term. The recent payrolls report and revisions released last month show that the job market is cooling from its earlier hot pace with no evidence of a downturn. Recent data has been broadly consistent with our soft landing base case and if anything, probabilities have coalesced even more around the base case.
Inflation is decelerating to more normal levels. With a cooling labor market, we would expect more progress on services inflation. The Fed has communicated that the “time has come” to begin cutting interest rates in response to falling inflation and slowing growth. The June SEP (Summary of Economic Projections) had the Fed Funds rate at 4.1% by the end of 2025, while the market expects an additional 125 basis points (bps) of cuts. Potential unwinding of rate cut expectations could be a source of volatility. Despite recent moderation, the U.S. growth outlook is much more constructive relative to Europe and China where slowing continues.
The S&P 500 saw 11% year-over-year earnings growth in the second quarter, of which nearly half came from stocks outside of the . This is a from the prior 2-3 quarters when their contribution was negative. We see a similar picture in the bond market where credit spreads have remained contained. The High Yield (HY) picture remains constructive with low default rates.
Our recommended 6-12 months tactical asset allocation broadly favors global equities over bonds. There are some valuation concerns around U.S. equities but strong earnings expectations and the broadening of equity markets keep us invested in them. Bonds may remain volatile if the market begins to price out rate cuts. This led us to go further underweight bonds. We do expect a bounce back in global equities but we removed our developed ex-U.S. equities overweight where the growth picture is a little muddy. The reductions in bonds and equities funded additions to Global Real Estate and Global Listed Infrastructure. Both asset classes should continue to benefit from the reduction in the rates environment. Investor sentiment was quite negative on Real Estate and we expect an improvement here as the asset class is highly leveraged to lower and declining rates. Further, Global Listed Infrastructure is particularly well positioned from an earnings and fundamentals perspective.
— Anwiti Bahuguna, Ph.D. – Chief Investment Officer, Global Asset Allocation
Magnificent Seven
The “Magnificent Seven” companies are Alphabet, Amazon, Apple, Meta, Microsoft, Nvidia, and Tesla, which drove the sharp rise in U.S. stocks in 2023.
S&P 500 EARNINGS BREADTH BROADENED
S&P 500 ex-Magnificent 7 contributed 5.4% to 2Q S&P 500 earnings growth, the highest level since early 2023.
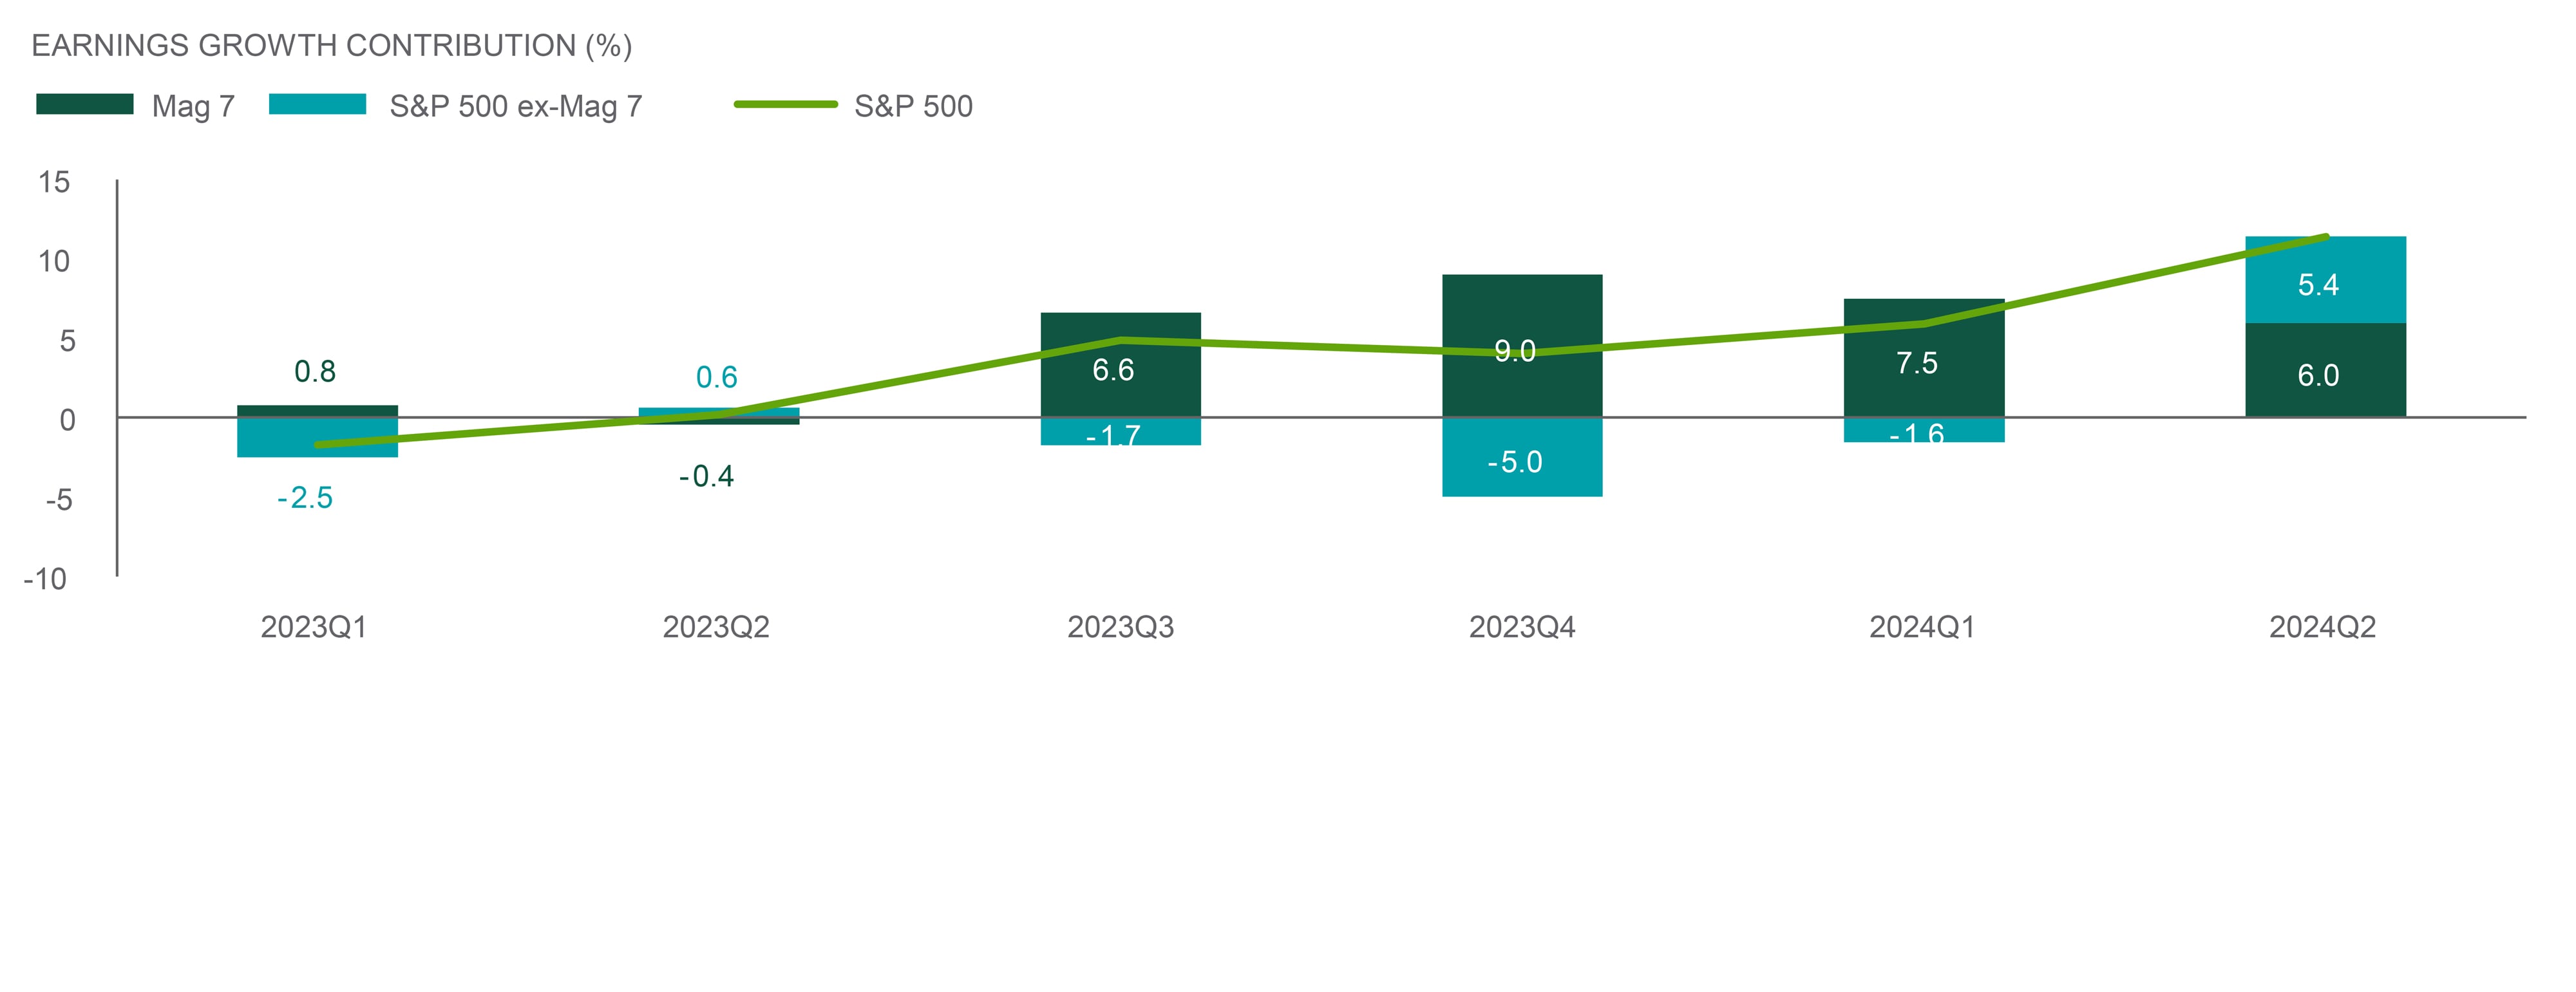
Source: Northern Trust Asset Management, Bloomberg, FactSet. Data as of 8/31/2024. Magnificent 7 = Mag 7.
Interest Rates
The shape of the yield curve (as measured by the difference between 2-year and 10-year Treasury yields), historically a closely watched indicator of economic recession, was inverted (it’s normally upward sloping) for more than two years. This is the longest such stretch in over 40 years. Recently, however, with all signs pointing to a rate cut at the September meeting, the yield curve has shifted to be upward sloping again.
While some are viewing this normalization as still a sign of imminent recession, we aren’t seeing such a scenario as very likely when looking at the totality of economic data recently. Indeed inflection points in the economic cycle are often confusing and difficult to predict, but we would caution against reading too much into signals from a single indicator like the shape of the yield curve. In fact, some other, less frequently watched, measures of yield curve shape like 2-year/5-year remain inverted as markets continue to wrestle with their outlook for the economy and monetary policy. While we’ll continue to monitor the yield curve, we suspect we won’t be writing about yield curve inversion (again) or recession any time soon.
— Dan LaRocco, Head of U.S. Liquidity, Global Fixed Income
Federal Open Market Committee
The Federal Open Market Committee (FOMC) of the Federal Reserve holds eight regularly scheduled meetings a year to review economic and financial conditions and determine monetary policy. It sets the federal funds rate target, which is achieved through open market purchases by the Federal Reserve and has a broad impact on interest rates in the financial system and the economy. The committee consists of 12 members from regional reserve banks.
INVERTED NO LONGER
The 2-year Treasury yield has fallen on rate cut expectations.
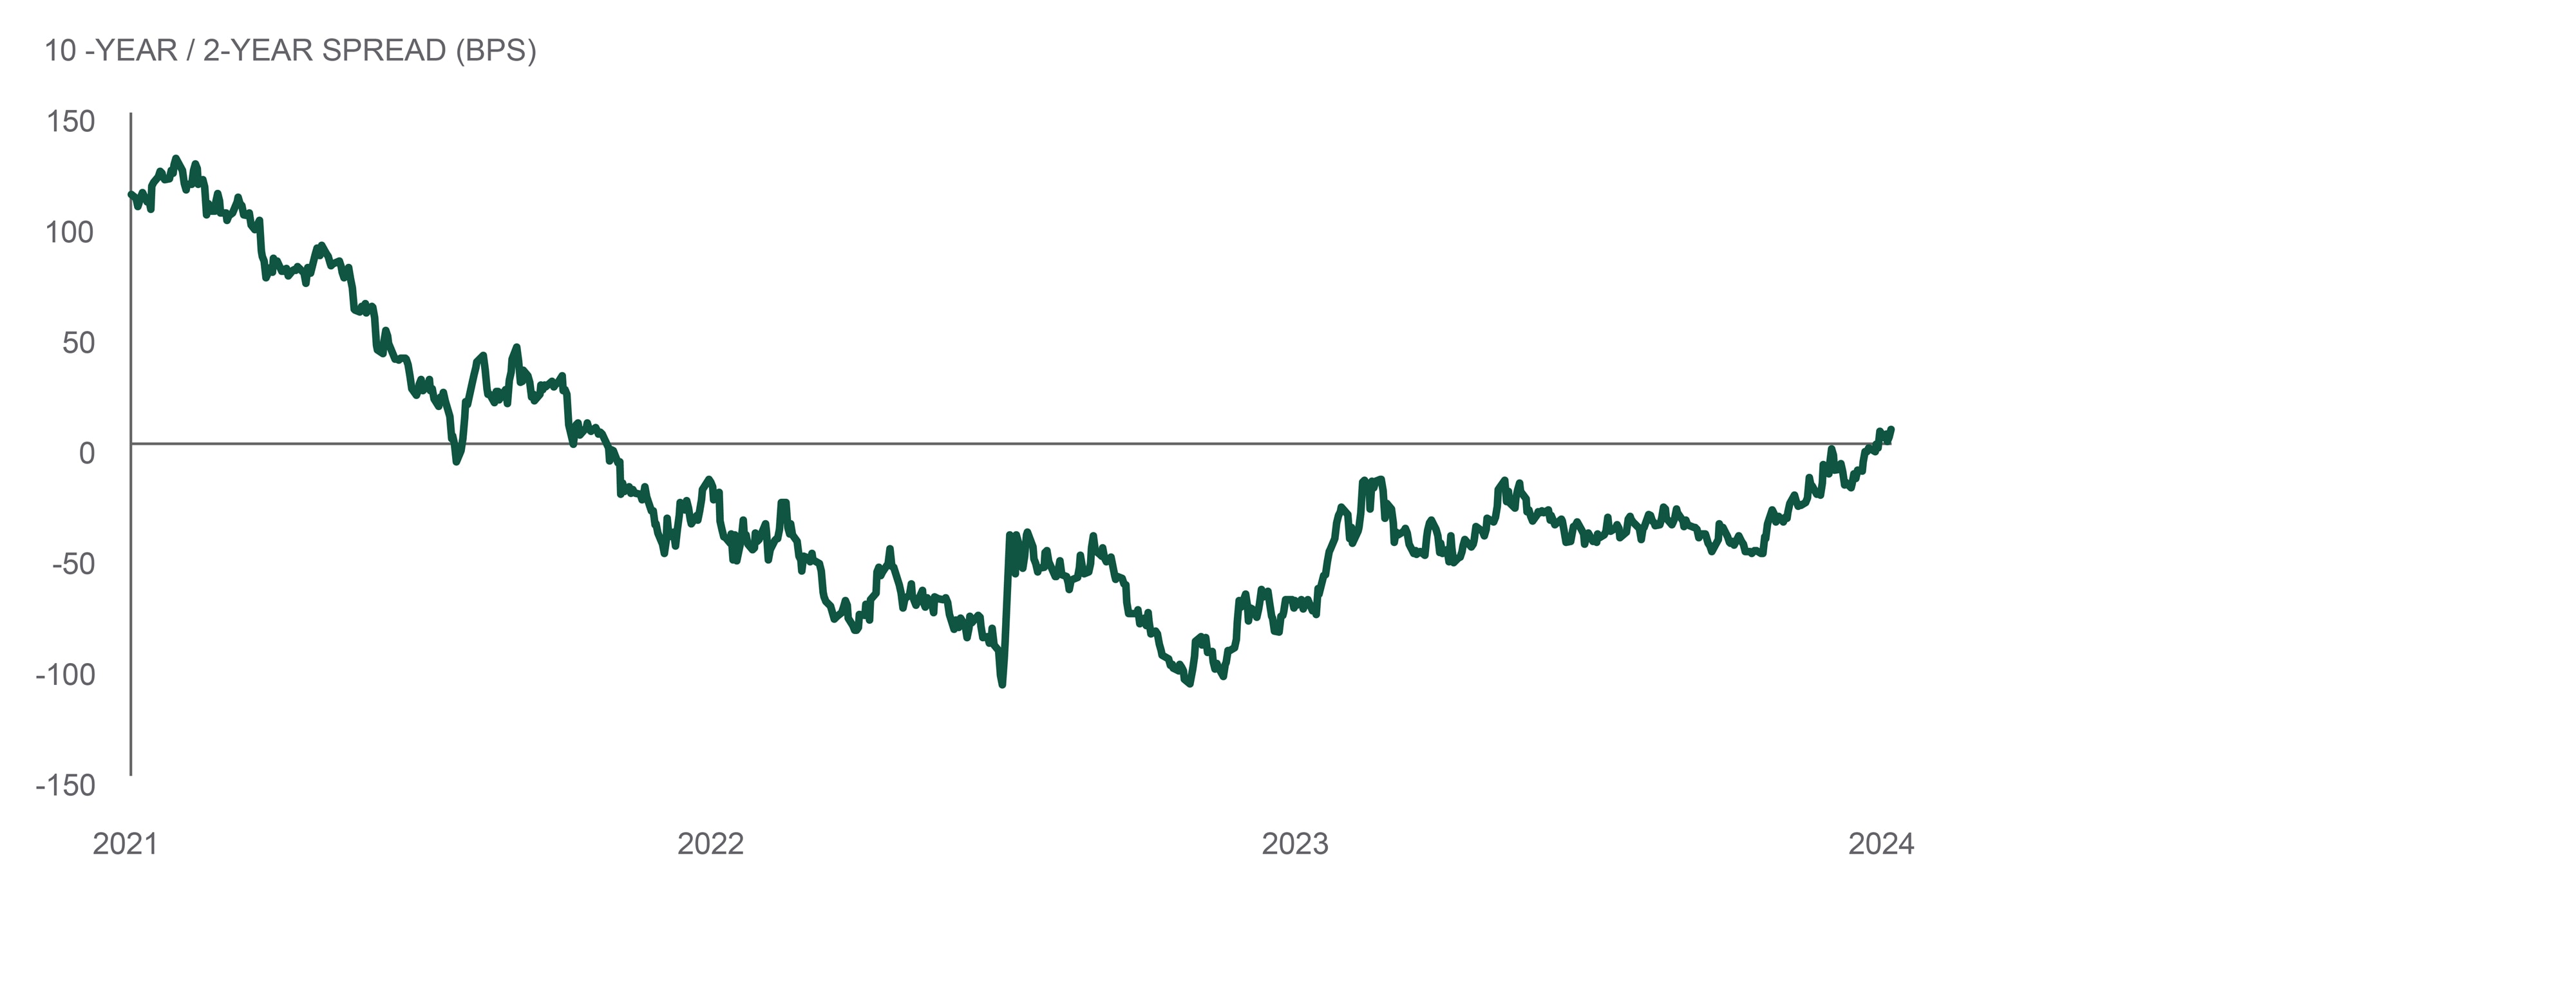
Source: Northern Trust Asset Management, Bloomberg. 10-Year/ 2-Year spread = 10-Year Treasury yield minus 2-Year Treasuryyield. BPS = basis points. Data from 9/10/2021 through 9/13/2024.
- The yield curve has begun to normalize after being inverted for over two years.
- Inflection points in the economic cycle are often difficult to predict.
- We would caution against reading too much into any one indicator like curve shape.
Credit Markets
High yield saw another strong month of performance, despite the uptick in volatility. Volatility increased significantly at the beginning of August, as markets encountered a “growth scare” from an unexpectedly weak employment report early in the month. High yield recovered quickly alongside equity markets as the month progressed, with additional economic data giving investors comfort that the economy was still broadly on solid footing.
High yield bonds have historically performed well following the first Fed rate cut. In the past, all five examples of rate cuts were accompanied by positive returns over the following three months for high yield bonds. Historically, higher quality credits typically outperform lower quality credits during a Fed easing cycle due to two primary factors. One is higher quality credits tend to have longer durations hence higher sensitivity to a decrease in rates, and the other being the Fed easing cycle has historically coincided with a steadily weakening economy leading to outperformance in higher quality companies. Given the high yield index is of higher credit quality versus prior Fed cutting cycles, this could be an additional tailwind for the asset class.
— Eric Williams, Head of Capital Structure, Global Fixed Income
HY TENDS TO OUTPERFORM POST RATE CUTS
High yield bonds have historically performed well following the first Fed cut.

Source: Northern Trust Asset Management, Bloomberg, JP Morgan Research. HY = High Yield; proxied by the JP Morgan High Yield Index. Data as of 9/11/2024. Historical trends are not predictive of future outcomes.
- In the past, all five examples of rate cuts were accompanied by positive returns over the following three months for high yield bonds.
- Higher quality credits typically outperform lower quality credits during a Fed easing cycle.
- Given the high yield index is of higher credit quality versus prior Fed cutting cycles, this could be an additional tailwind for the asset class.
Equities
In August, U.S. large cap stocks were down 6.1% over the first three trading days before rallying 9.1% to finish the month 2.4% higher, as concerns about the yen carry trade and U.S. growth dissipated. Defensive stocks performed well, while value modestly outperformed growth. Developed ex-U.S. equities were up 3.3% getting a significant boost from dollar weakness. Volatility roared loudly before hastily retreating, although it has picked up again in September. Increased volatility is not unusual in a run up to the start of a Fed rate cut cycle. September, historically the weakest performing month, has lived up to its reputation thus far with semiconductors once again leading the way down and defensive stocks outperforming.
Recent data and market events have not altered our constructive fundamental views of a and solid corporate profits – second quarter earnings season wrapped up with 11.3% earnings growth, broad sector participation, and a strong outlook for the next 12 months. We reaffirmed our overweight equity positioning in the U.S. and emerging markets, but removed our overweight to developed ex-U.S. equities given a less-favorable economic growth outlook in Europe.
— Jordan Dekhayser, Head of Equity Client Portfolio Management
Economic Soft Landing
A soft landing is a slowdown in economic growth that avoids recession. Often, central banks seek to increase interest rates just enough temper high inflation without causing an economic downturn.
IN LIKE A LION, OUT LIKE A LAMB
Global Equities finished a volatile August on a high note.
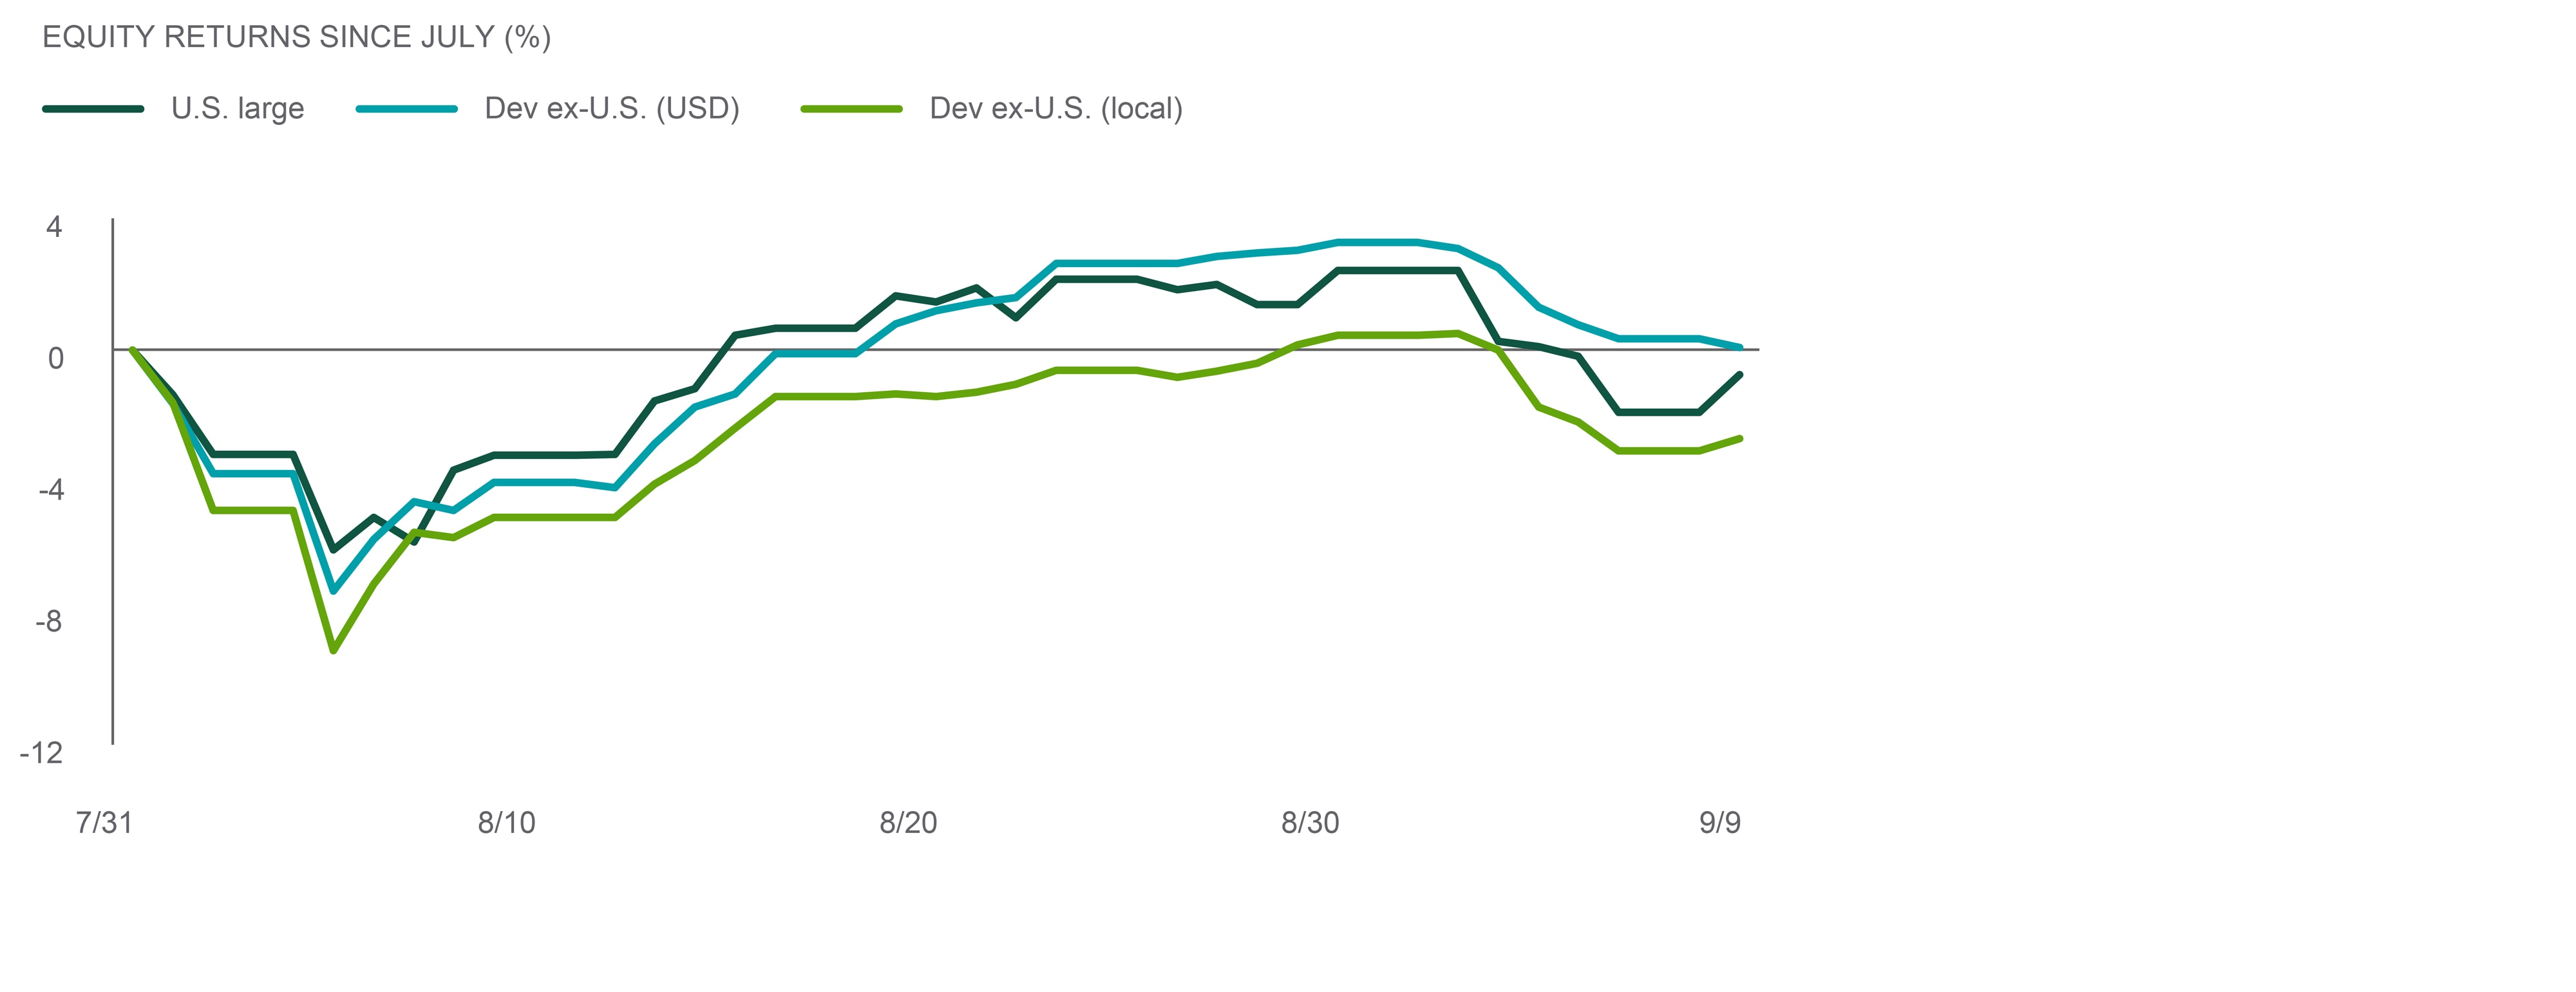
Source: Northern Trust Asset Management, Bloomberg. Total return data from 7/31/2024 through 9/10/2024. Past performance is not indicative or a guarantee of future results. Index performance returns do not reflect any management fees, transaction costs or expenses. It is not possible to invest directly in any index.
- August was a volatile month for global equities, but finished on a high note. Developed ex-U.S. equities received a significant boost from a weaker dollar.
- Increased volatility heading into a rate cut cycle is not unusual as investors debate economic outcomes.
- We reaffirm our constructive view on equities, but removed our overweight to developed ex-U.S. equities given a less-favorable economic growth outlook in Europe
Real Assets
We have become more constructive on Global Listed Infrastructure (GLI), and have taken an overweight position in our tactical portfolio. Over the longer term, infrastructure can provide investors exposure to indirect ownership of necessity-based assets with defensive/quality cash flows and revenue agreements with regulated or contractual pricing. More recently, infrastructure has drawn investor interest due to positive short-term fundamentals with strong growth from increasing demand for global power as well as increasing attractiveness in a decreasing and lower rate environment. These positive fundamentals and a lower cost of capital are expected to lead to high single-digit earnings growth in infrastructure for each of the next few years.
From a valuation perspective, GLI screens historically cheaply, which bodes well for its expected intermediate and longer-term performance and could provide downside protection. Specifically, listed infrastructure currently trades at 17.4x forward earnings, while the ACWI trades at 17.7x. Historically, infrastructure has traded at a 16% premium to the broader market, reflective of the infrastructure sector’s attractive attributes.
— Jim Hardman, Head of Real Assets, Multi-Manager Solutions
OPPORTUNITIES IN INFRASTRUCTURE
Listed Infrastructure looks attractive on several metrics.

Source: Northern Trust Asset Management, FactSet. Data as of 8/31/2024. ACWI = MSCI AC World, Infra = S&P Global Infrastructure. P/E = Price-to-earnings. Past performance is not a guarantee of future results. It is not possible to invest directly in an index. Diversification and asset allocation do not assure a profit or protect against loss.
- GLI has drawn investor interest due to a number of positive attributes and fundamental growth opportunities.
- The sector screens historically cheaply as well, providing a roadmap to longer-term outperformance.
- We have become more constructive on and have taken overweight positions in both GRE and GLI while maintaining an underweight to GNR.
Real Assets
Real assets include real estate (such as commercial offices), infrastructure (airports) and natural resources (metals). Investors value them as portfolio diversifiers their returns often don't correlate with stocks and bonds.
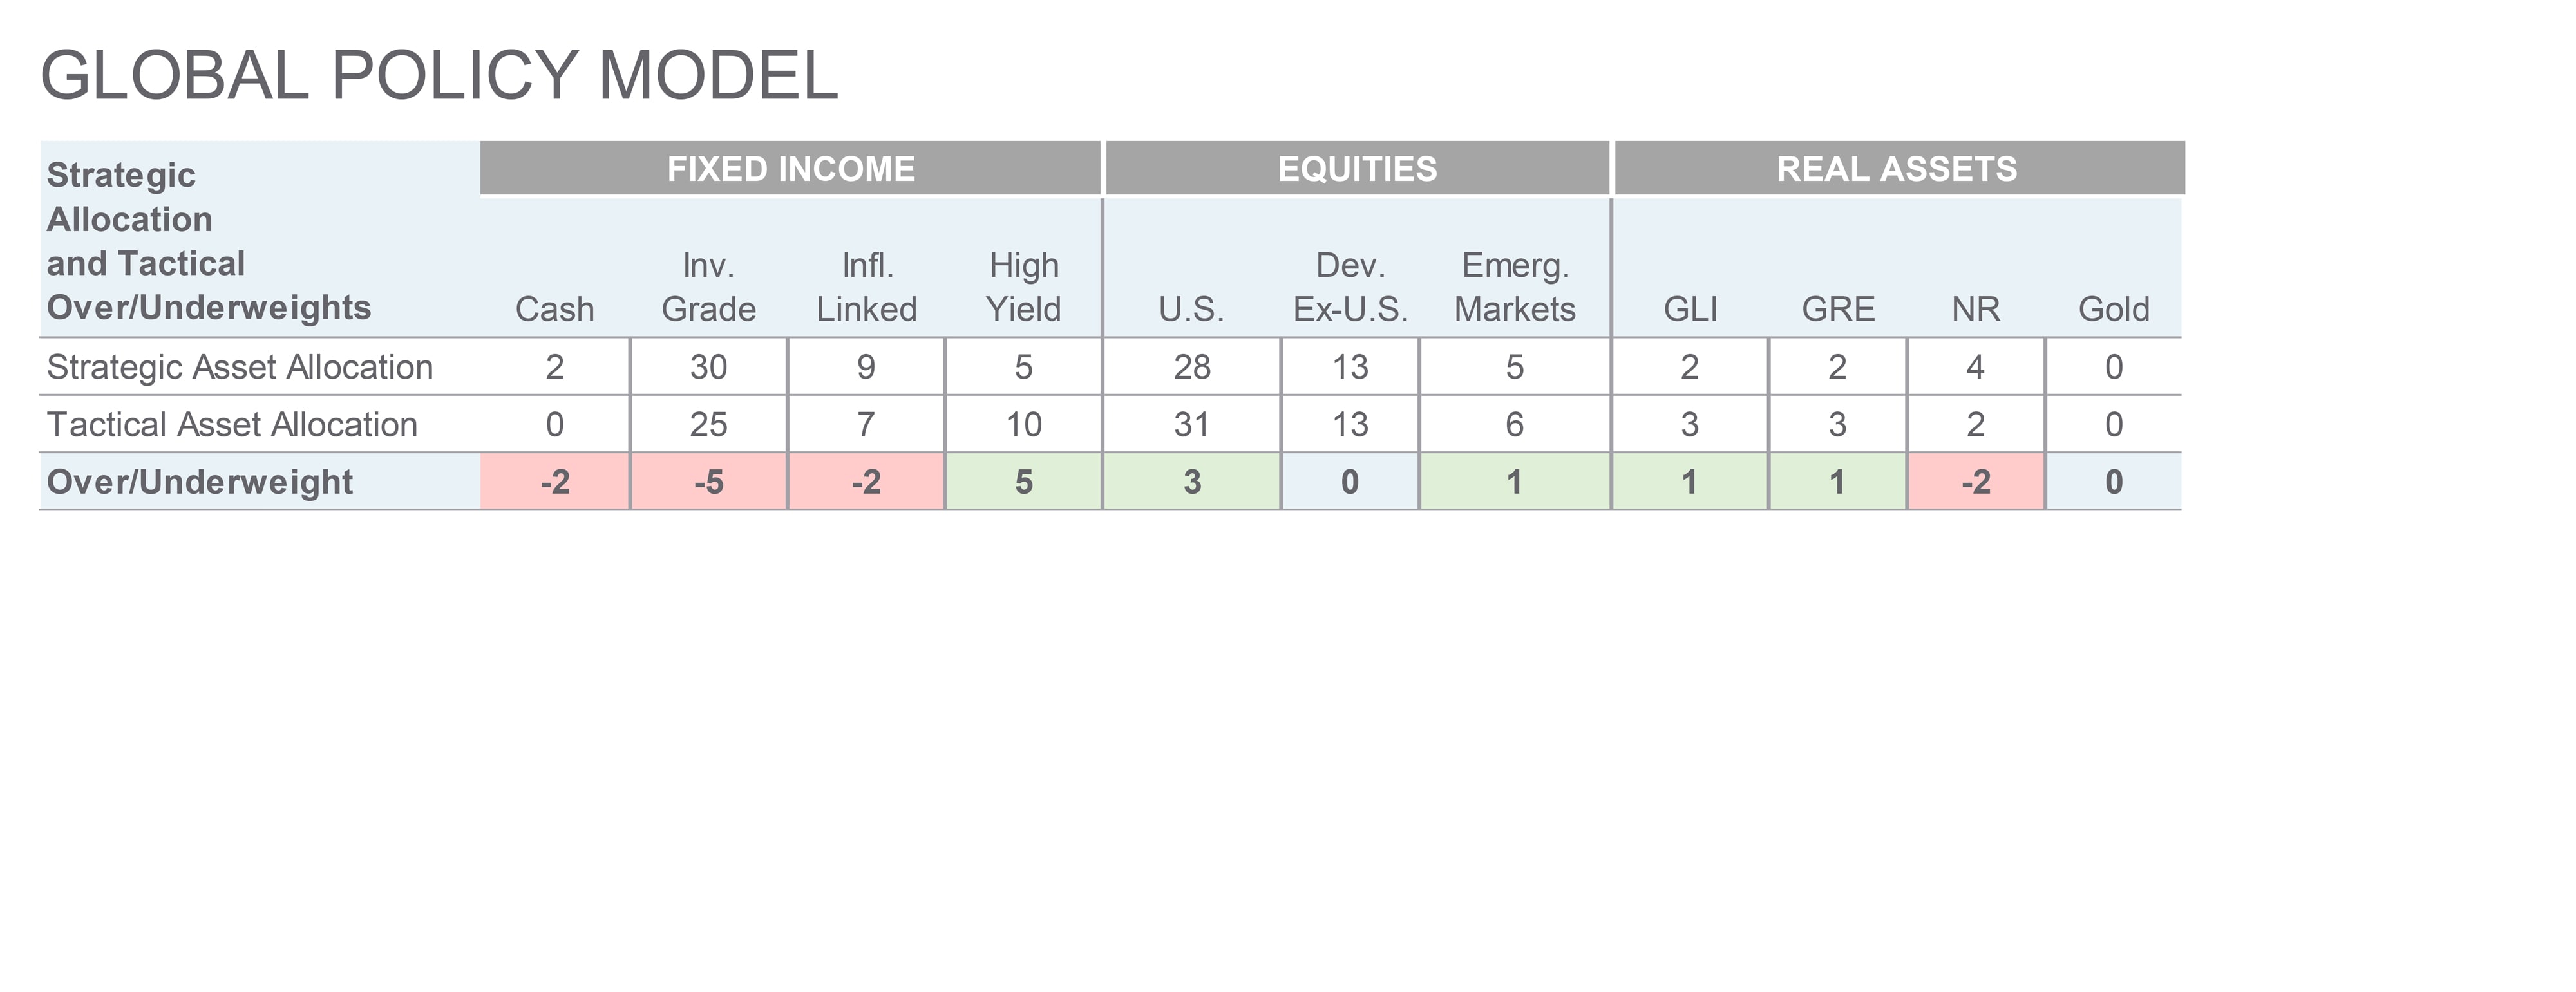
Source: Northern Trust Capital Market Assumptions Working Group, Investment Policy Committee. Strategic allocation is based on capital market return, risk and correlation assumptions developed annually; most recent model released 8/9/2023.The model cannot account for the impact that economic, market and other factors may have on the implementation and ongoing management of an actual investment strategy. Asset allocation does not guarantee a profit or protection against a loss in declining markets. GLI = Global Listed Infrastructure, GRE = Global Real Estate, NR = Natural Resources.
Unless noted otherwise, data on this page is sourced from Bloomberg as of September 2024.
Main Point
S&P 500 Growth Expands Beyond Key Players
The market appears to have responded positively to the broadening of S&P 500 earnings, with growth likely driven by a wider range of companies beyond the usual leaders. This shift may indicate a more balanced market, potentially offering new growth opportunities as markets evolve.

Contact Us
Interested in learning more about our expertise and how we can help?
MSCI All Country World Index (MSCI ACWI) is a stock index that tracks nearly 3,000 stocks in 48 developed and emerging market countries. It is not possible to invest directly in an index.
S&P 500® Index is an unmanaged index consisting of 500 stocks and is a widely recognized common measure of the performance of the overall U.S. stock market. It is not possible to invest directly in an index.
S&P Global Infrastructure Index provides liquid and tradable exposure to 75 companies from around the world that represent the listed infrastructure universe. The Index has balanced weights across three distinct infrastructure clusters: Utilities, Transportation, and Energy. It is not possible to invest directly in an index.
IMPORTANT INFORMATION
This content may not be edited, altered, revised, paraphrased, or otherwise modified without the prior written permission of Northern Trust Asset Management (NTAM). The information contained herein is intended for use with current or prospective clients of Northern Trust Investments, Inc (NTI) or its affiliates. The information is not intended for distribution or use by any person in any jurisdiction where such distribution would be contrary to local law or regulation. NTAM and its affiliates may have positions in and may effect transactions in the markets, contracts and related investments different than described in this information. This information is obtained from sources believed to be reliable, its accuracy and completeness are not guaranteed, and is subject to change. Information does not constitute a recommendation of any investment strategy, is not intended as investment advice and does not take into account all the circumstances of each investor.
This report is provided for informational purposes only and is not intended to be, and should not be construed as, an offer, solicitation or recommendation with respect to any transaction and should not be treated as legal advice, investment advice or tax advice. Recipients should not rely upon this information as a substitute for obtaining specific legal or tax advice from their own professional legal or tax advisors. References to specific securities and their issuers are for illustrative purposes only and are not intended and should not be interpreted as recommendations to purchase or sell such securities. Indices and trademarks are the property of their respective owners. Information is subject to change based on market or other conditions.
All securities investing and trading activities risk the loss of capital. Each portfolio is subject to substantial risks including market risks, strategy risks, advisor risk, and risks with respect to its investment in other structures. There can be no assurance that any portfolio investment objectives will be achieved, or that any investment will achieve profits or avoid incurring substantial losses. No investment strategy or risk management technique can guarantee returns or eliminate risk in any market environment. Risk controls and models do not promise any level of performance or guarantee against loss of principal. Any discussion of risk management is intended to describe NTAM’s efforts to monitor and manage risk but does not imply low risk.
Past performance is not a guarantee of future results. Performance returns and the principal value of an investment will fluctuate. Performance returns contained herein are subject to revision by NTAM. Comparative indices shown are provided as an indication of the performance of a particular segment of the capital markets and/or alternative strategies in general. Index performance returns do not reflect any management fees, transaction costs or expenses. It is not possible to invest directly in any index. Net performance returns are reduced by investment management fees and other expenses relating to the management of the account. Gross performance returns contained herein include reinvestment of dividends and other earnings, transaction costs, and all fees and expenses other than investment management fees, unless indicated otherwise. For additional information on fees, please refer to Part 2a of the Form ADV or consult an NTI representative.
Forward-looking statements and assumptions are NTAM’s current estimates or expectations of future events or future results based upon proprietary research and should not be construed as an estimate or promise of results that a portfolio may achieve. Actual results could differ materially from the results indicated by this information.
This information is intended for purposes of NTI and/or its affiliates marketing as providers of the products and services described herein and not to provide any fiduciary investment advice within the meaning of Section 3(21) of the Employee Retirement Income Security Act of 1974, as amended (ERISA). NTI and/or its affiliates are not undertaking to provide a recommendation or give investment advice in a fiduciary capacity to the recipient of these materials, which are for marketing purposes and are not intended to serve as a primary basis for investment decisions. NTI and/or its affiliates may receive fees and other compensation in connection with the products and services described herein as well as for custody, fund administration, transfer agent, investment operations outsourcing, and other services rendered to various proprietary and third-party investment products and firms that may be the subject of or become associated with the services described herein.
Northern Trust Asset Management is composed of Northern Trust Investments, Inc. Northern Trust Global Investments Limited, Northern Trust Fund Managers (Ireland) Limited, Northern Trust Global Investments Japan, K.K, NT Global Advisors, Inc., 50 South Capital Advisors, LLC, Northern Trust Asset Management Australia Pty Ltd, and investment personnel of The Northern Trust Company of Hong Kong Limited and The Northern Trust Company.
Not FDIC insured | May lose value | No bank guarantee