Investment Perspective
- Who We Serve
- What We Do
- About Us
- Insights & Research
- Who We Serve
- What We Do
- About Us
- Insights & Research
Save to bookmarks
Investment Perspective · 05.23.24
Resilient Consumers Support Growth
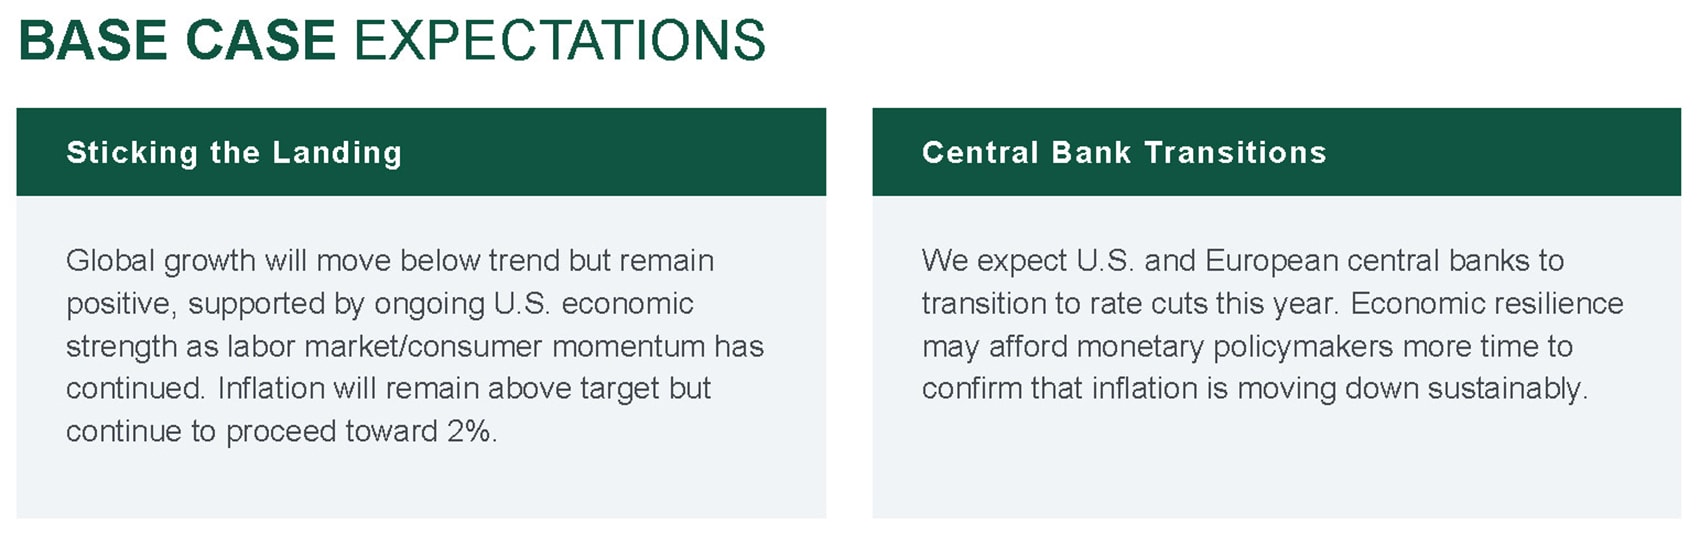
Economic growth remains strong as consumer resilience and a solid labor market counteract inflation concerns.
- Portfolio Construction
- Fixed Income Insights
- High Yield Strategy
- Risk management
Resilient Consumers Support Growth
Save to bookmarks
Save to bookmarks
Key Points
What it is
We examine how resilient consumer behavior and a robust job market may contribute to economic stability and growth.
Why it matters
Evaluating the resilience of critical economic drivers helps investors understand market dynamics and the potential for future growth.
Where it's going
Economic projections suggest sustained growth, driven by strong consumer demand and stable employment, even as inflationary pressures persist.
Economic forecasters have been revising estimates up for growth all year. Resiliency last year was explained away as funded by excess pandemic savings. So far this year, growth has remained remarkably strong but improvement in inflation data has stalled. Both the of the economy and upward pressure on prices are a sign of strength. There was some “headline” weakness in first-quarter U.S. Gross Domestic Product due to volatile and unpredictable components, but underlying domestic demand remained strong at over 3%. Consumption, housing and investments all contributed to growth.
With the unemployment rate below 4%, the strength of the consumer is supported by a strong labor market. Payrolls were softer for the first time in April, but these are slowing down from red hot levels which might allow wage growth to cool down. Real incomes are growing as nominal wage growth is ahead of inflation and real incomes are rising across all income quintiles. The savings rate is low, but low rates are associated with periods of rising wealth when consumers are less worried about the future. Consumer balance sheets show few signs of stress. Delinquencies are up from record lows and debt servicing ratios remain near historic lows. Pandemic distortions are still being worked through the spending patterns. Strong economic growth puts some upward pressure on prices, which has been reflected in recent data. We don’t view this as a sign of concern but rather of underlying strength.
The impact of is likely behind us.
Higher rates may continue to bite those borrowing at these levels but this is not a signal for a recession. Wage growth is moderating and inflation expectations are anchored. The Fed is not likely to raise rates unless inflation reaccelerates, and Chair Powell recently reiterated that this is not the Fed’s expectation. We are anticipating cuts from most of the major developed central banks this year. Moreover, economic strength is broadening globally. We see improved momentum in Europe and China as global manufacturing is stabilizing.
The ongoing expansion points to further upside for global stocks relative to bonds. Although U.S. equity valuations are elevated, we think equities will continue to trend higher if earnings continue to rise as expected. We prefer equities over bonds with overweight exposures across all the major equity regions. We are funding part of that overweight with an underweight to natural resources. Within fixed income, the comparatively longer-duration of investment grade (IG) corporate bonds makes them more vulnerable to rising government bond yields and contributes to our preference for high yield (HY) issues. There is also little scope for a meaningful further tightening of spreads, and we like the return advantage for HY bonds relative to IG bonds from higher income yields. We are underweight IG, inflation-protected bonds, and cash within our fixed income allocation.
— Anwiti Bahuguna, Ph.D. – Chief Investment Officer, Global Asset Allocation
Monetary tightening
Monetary tightening reduces the money supply in the economy, which may slow down the economy and reduce inflation.
Exhibit 1: REAL WAGE GROWTH SUPPORTS CONSUMER SPENDING
Real wages have continued to rise, while the aggregate consumer balance sheet shows few signs of stress.
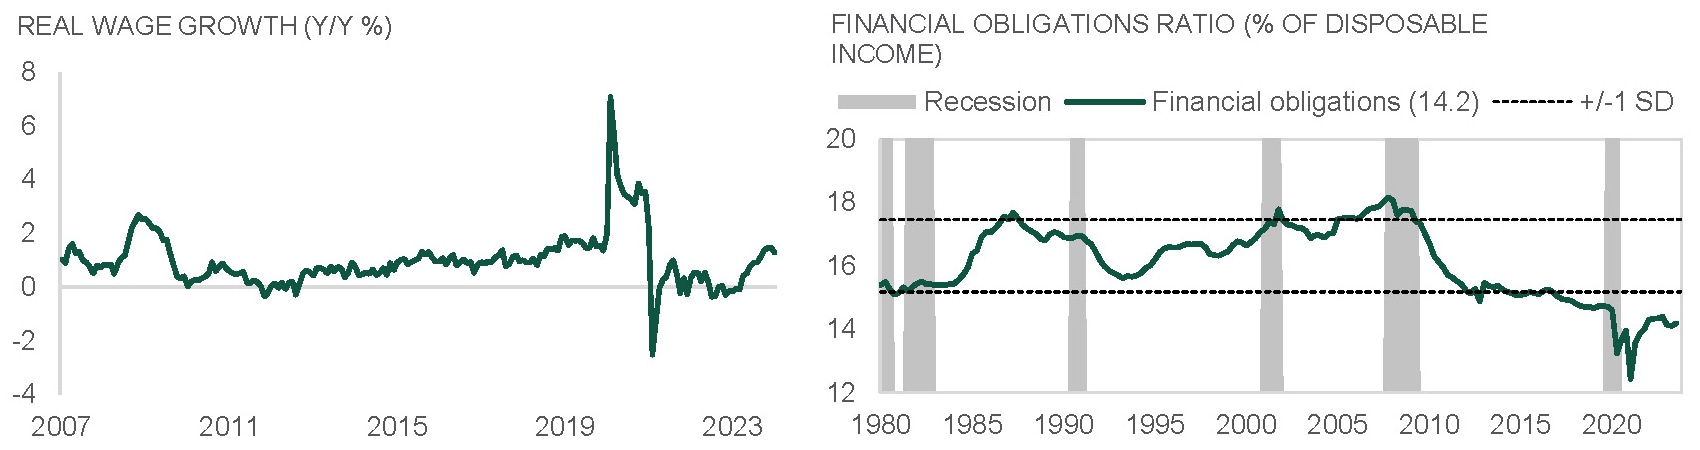
Source: Northern Trust Asset Management, Bloomberg, Federal Reserve. Latest data as of 4/30/2024. Real wages are average hourly earnings less personal consumption expenditures. Year-over-year = Y/Y. SD = standard deviation.
Interest Rates
We took the main message from the May meeting to be that the path of economic data this year, especially inflation data, has not given the Committee “greater confidence that inflation is moving sustainably toward 2 percent”1 and, as a result, it will take longer than initially expected for the Committee to start cutting rates.
As we discussed last month, the FOMC’s policy statement also included an update on the Committee’s plan to reduce the size of its balance sheet. Beginning next month, they will, “[reduce] the monthly redemption cap on Treasury securities from $60 billion to $25 billion*.”1 This reduction slightly exceeded the widely held expectation that they would cut the cap in half to $30 billion. The cap on mortgage-backed securities will remain unchanged at $35 billion as widely expected. U.S. Treasury yields were little changed following the release of the statement, as the market (correctly in our view) focused more so on the implications of Powell’s press briefing on the Federal Funds Target Range – their main tool for adjusting monetary policy.
— Dan LaRocco, Head of U.S. Liquidity, Global Fixed Income
FOMC
The Federal Open Market Committee (FOMC) of the Federal Reserve holds eight regularly scheduled meetings a year to review economic and financial conditions and determine monetary policy. It sets the federal funds rate target, which is achieved through open market purchases by the Federal Reserve and has a broad impact on interest rates in the financial system and the economy. The committee consists of 12 members from regional reserve banks.
EXHIBIT 2: LONGER THAN EXPECTED
Yields were most responsive to the press conference.
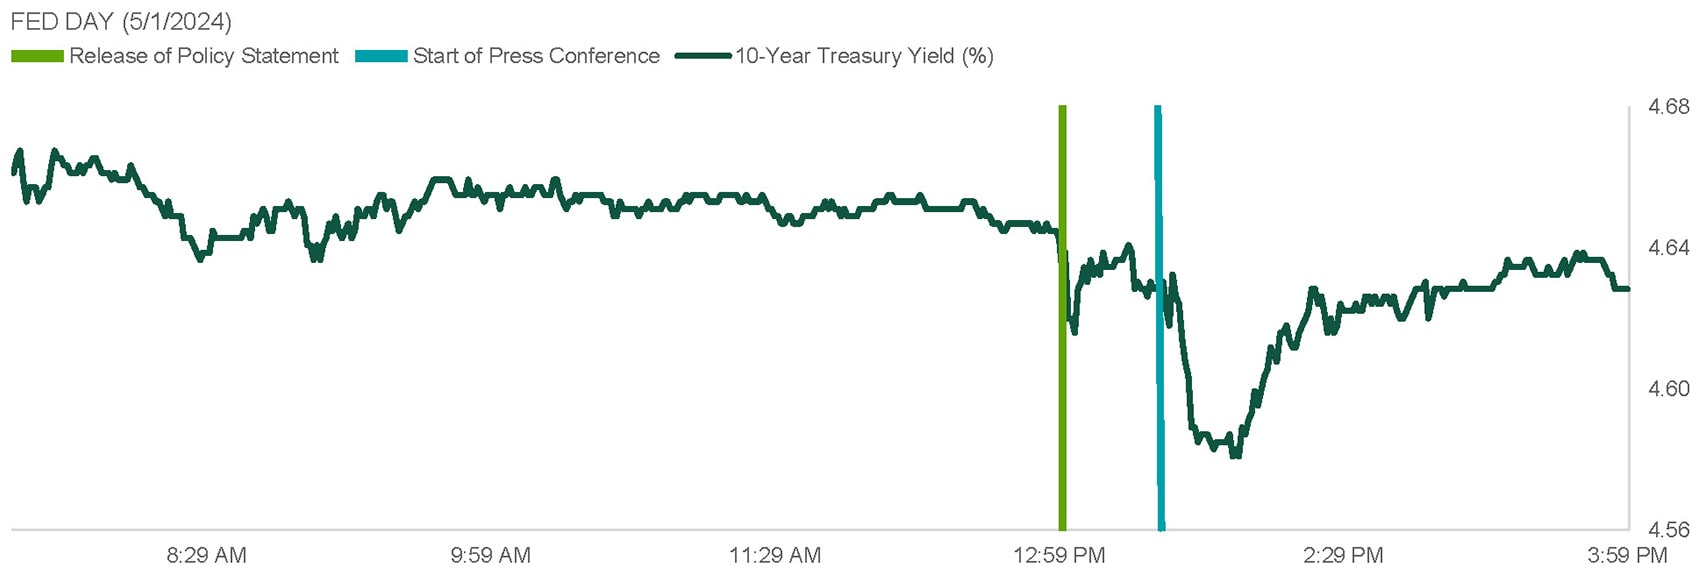
Source: Northern Trust Asset Management, Bloomberg. Intra-day data on 5/1/2024. Times are shown in Central Daylight Time (CDT). 1Federal Reserve.
- Treasury yields were little changed in response to the FOMC policy statement, which stated that the Fed will reduce the pace of .
- Interest rates were more responsive to the post-meeting press conference, when Chair Powell stated it will take longer than initially expected to cut rates.
- We think the Fed remains unlikely to raise rates, and we expect it to start cutting its policy rate in September.
Credit Markets
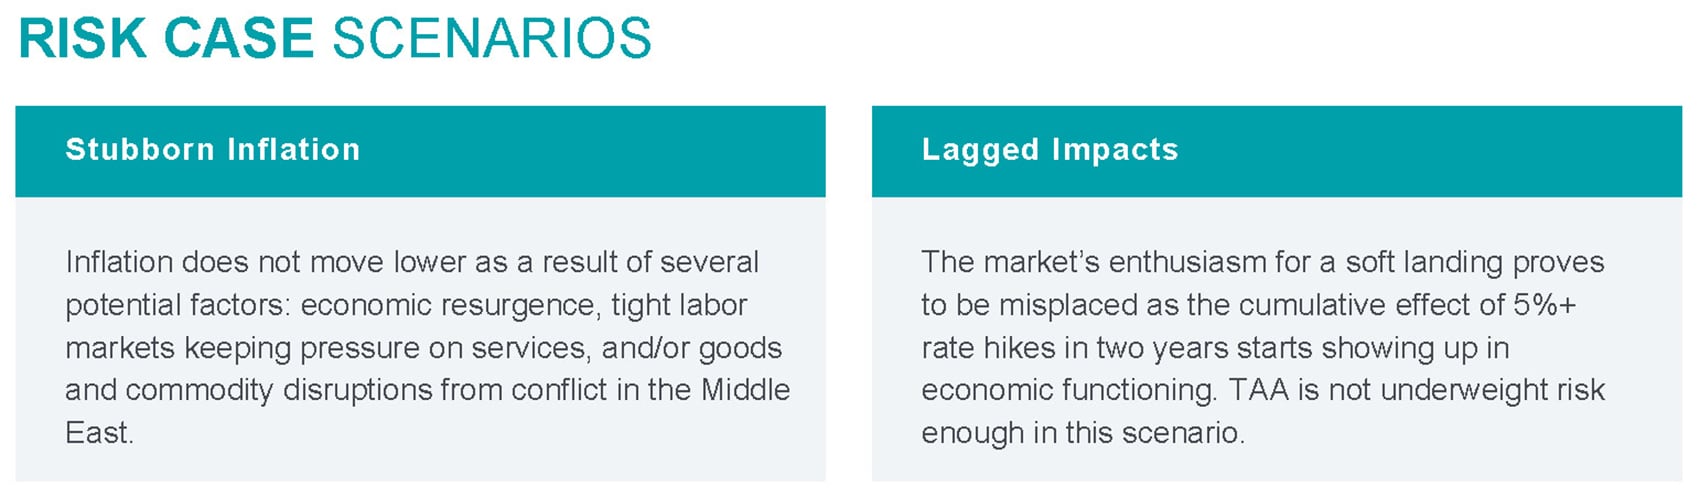
High yield (HY) saw its worst performance in six months driven by rate and risk volatility. Dispersion continues to be a theme for the asset class with higher quality trading tighter and elevated levels of distress primarily in the TMT sector. Despite valuations in higher quality, the attractive yield carry continues to pique investor interest. Inflation also continues to be topical, especially on the back of heightened geopolitical tensions out of the Middle East. Commodity prices have been on the rise as a result.
High energy prices can put strain on margins for the overall economy, but the high yield market is better positioned with greater exposure to energy versus most other asset classes. Energy HY index exposure is almost 2x greater than investment grade and 3x greater than the S&P 500. The higher energy exposure allows for a better hedge against rising energy prices. Despite the increase in volatility, fundamentals overall continue to be stable. The number of high yield bond issuers upgraded in April exceeded downgrades. April was the most favorable mix of upgrades versus downgrades since July 2023. This dynamic has provided support for high yield valuations and our recommended tactical overweight to the asset class.
— Eric Williams, Head of Capital Structure, Global Fixed Income
Quantitative Tightening (QT)
Quantative tightening is a contractionary policy the Federal Reserve uses to decrease the amount of money in the economy by selling government bonds, which PMI is an economic tool that tracks month-over-month changes in the manufacturing sector. A PMI above 50 indicates expansion, while a reading under 50 represents a contraction. increases interest rates and helps control inflation.
EXHIBIT 3: ENERGY EXPOSURE
High yield has a relatively high energy exposure.
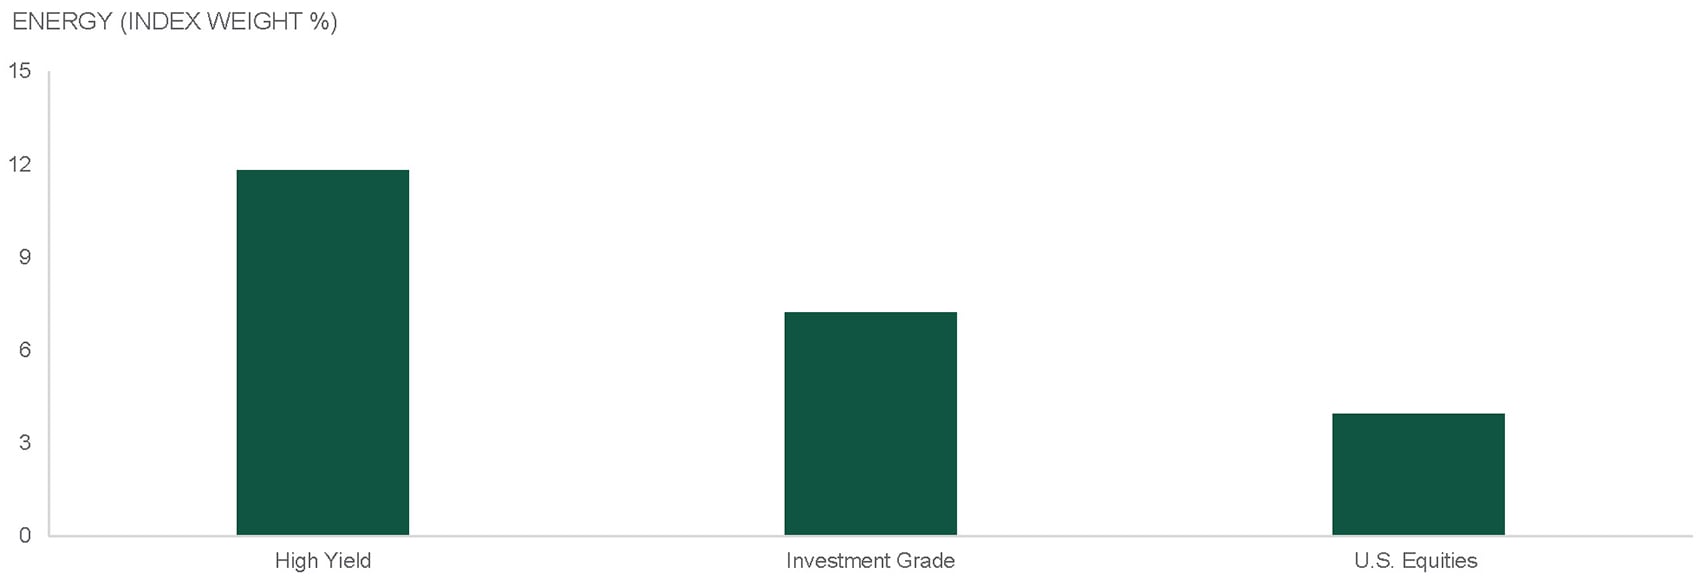
Source: Northern Trust Asset Management, Bloomberg. High Yield = Bloomberg U.S. High Yield 2% Issuer Cap Index. U.S. Equities = S&P 500 Index. Investment Grade = Bloomberg U.S. Credit Index. Data as 5/8/2024. TMT = Technology, Media and Telecom.
- High yield recently saw its worst performance in six months driven by rate and risk volatility.
- Commodity inflation is a tailwind for pockets of the high yield market, and can support high yield valuations.
- We remain 5% overweight high yield given stable fundamentals and an attractive income yield.
Equities
After a 3.2% loss in April, global equities have regained momentum and recovered almost all of that dip so far in May. While U.S. equities have retained year-to-date leadership, non-U.S. markets have outperformed more recently. Over the past month, Europe and emerging market equities have returned more than the U.S. We suspect that part of the recent international leadership has been driven by signs that economic momentum is broadening out from the U.S. to other areas of the world.
We increased our tactical equity positioning to overweight by adding 3% to U.S. equities and 1% to both developed ex-U.S. and emerging market equities. As shown in the chart, there have been limited periods in which bonds have persistently outperformed stocks. Recession has generally surrounded those periods. We assign a low probability to recession, and our baseline outlook for a and easing central banks should bode well for equities. Easing growth and lower inflation could lead to incrementally lower interest rates, but as long as those moves occur against a non-recessionary backdrop we expect equities to lead other assets. Beyond the macro backdrop, the earnings outlook remains strong across all three major regions.
— Colin Cheesman, Investment Strategist, Asset Allocation
Economic Soft Landing
A soft landing is a slowdown in economic growth that avoids recession. Often, central banks seek to increase interest rates just enough temper high inflation without causing an economic downturn.
EXHIBIT 4: TAKING STOCK
Absent recession, stocks tend to outperform bonds.
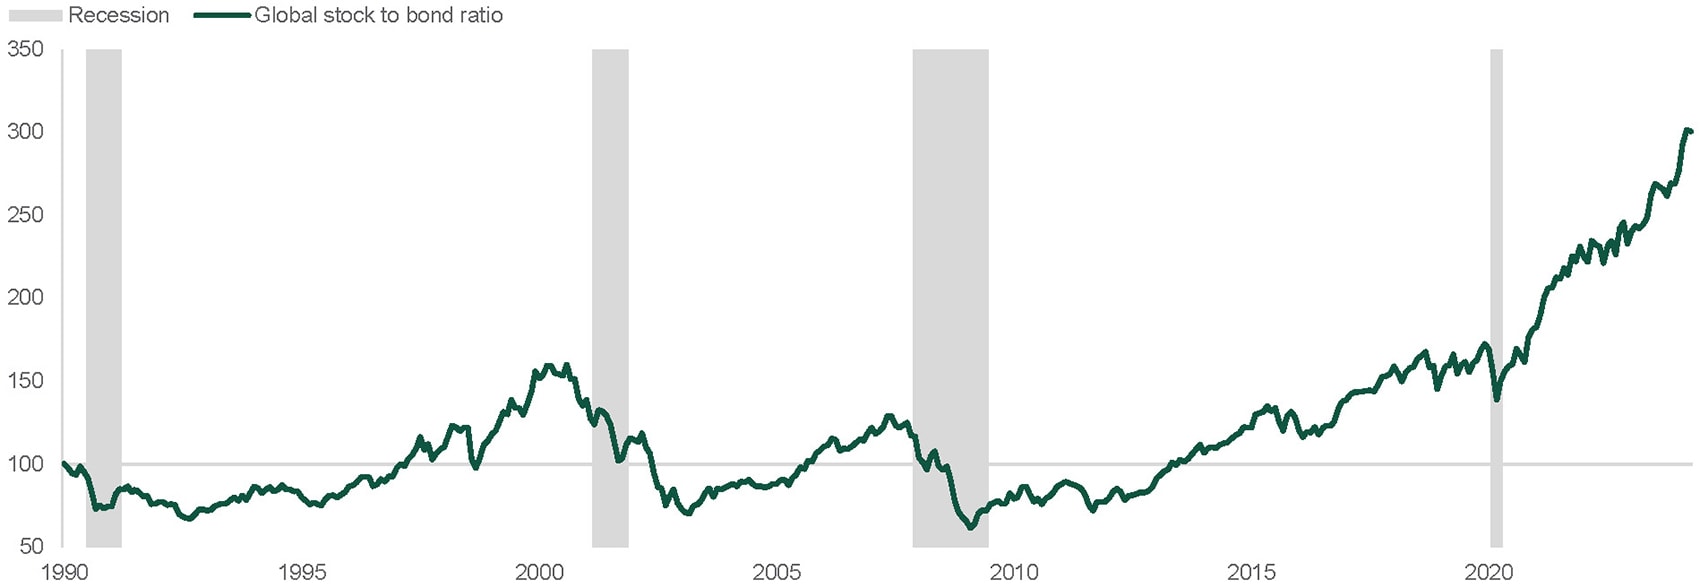
Source: Northern Trust Asset Management, Bloomberg. Ratio is the total return of global stocks (MSCI ACWI) versus global bonds (Bloomberg Global Agg), indexed to 100 on 1/31/1990. U.S. recessions shown. Data from 1/31/1990 through 4/30/2024.
- Global equities have regained momentum after a weak April. Non-U.S. equities have exhibited leadership alongside signs that global growth is broadening.
- Absent recession, equities tend to be the better relative return choice vis-à-vis fixed income.
- We added 5% to global equities and are now tactically overweight all three regions. We retain our soft landing base case and assign low probability to recession.
Real Assets
Global power demand has been relatively flat over the past decade with growth slowed by LED lighting adoption. With the arms race for AI market share, data centers are increasingly coming into investor focus. The group is expected to drive an inflection in power demand growth. AI data centers are equipped with vast computing resources specifically designed for AI workloads. These facilities currently use approximately 7x as much power as traditional data centers. It is estimated that AI could add another 700 Terawatt-Hours (TWhs) to U.S. power demand by 2030, which would be a 20% increase from past projections. Utilities and others are expected to utilize a number of sources to meet this increased power load including renewables, nuclear and traditional energy.
Increasing power demand should present significant structural opportunities for whether they are data center owners, integrated and renewable utilities, independent power producers, or midstream energy infrastructure. Further, this increasing demand will require sizable capex to build out the power grid and improve global transmission and distribution of power.
— Jim Hardman, Head of Real Assets, Multi-Manager Solutions
Real Assets
Real assets include real estate (such as commercial offices), infrastructure (airports) and natural resources (metals). Investors value them as portfolio diversifiers their returns often don't correlate with stocks and bonds.
EXHIBIT 5: POWER DEMAND SURGE
AI data centers are expected to drive power demand.
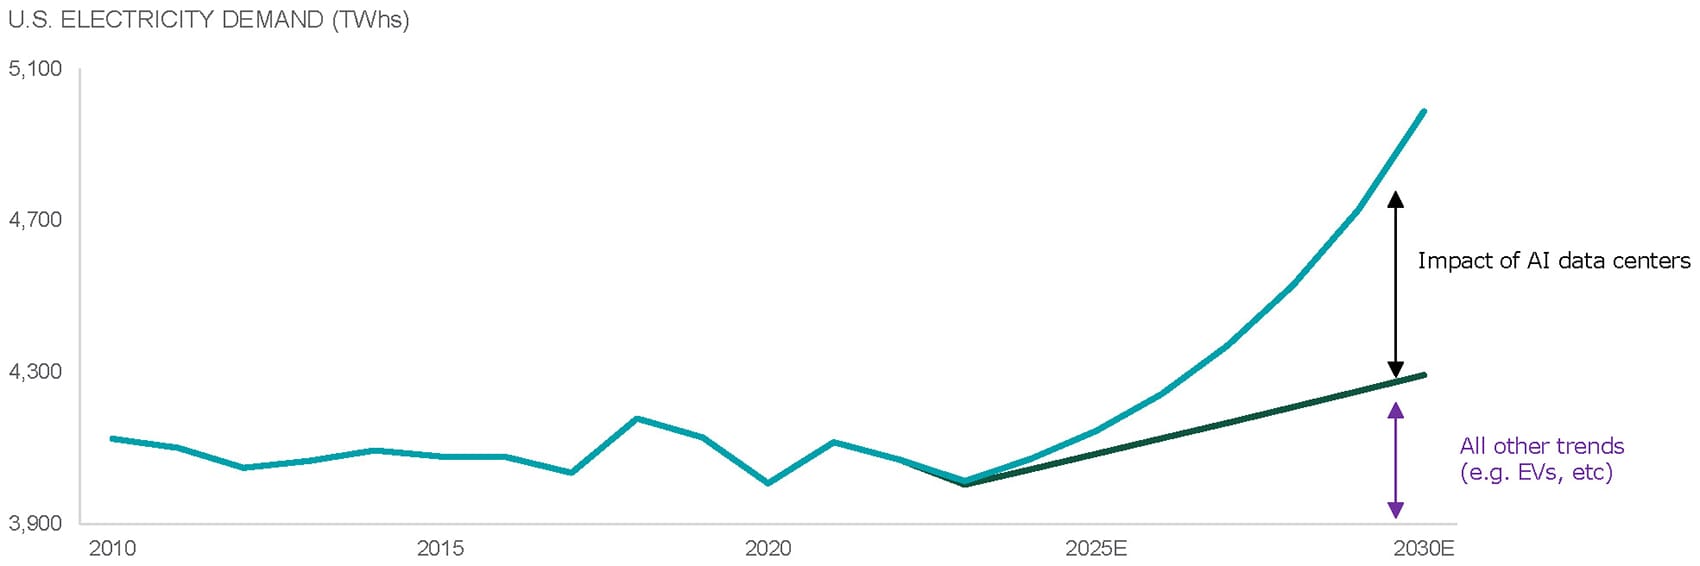
Source: Northern Trust Asset Management, Wells Fargo Securities. U.S. electricity demand is measured in Terawatt-Hours (TWhs).
- AI data centers require 7x as much power as traditional data centers. Global power demand is estimated to increase 20% over the next 5-7 years.
- This could provide significant structural growth opportunities across the real assets space.
- While valuations and longer-term trends make for attractive structural opportunities, we are tactically neutral listed infrastructure and real estate, and maintain a 2% underweight to natural resources given our expectation for a slowing-growth environment.
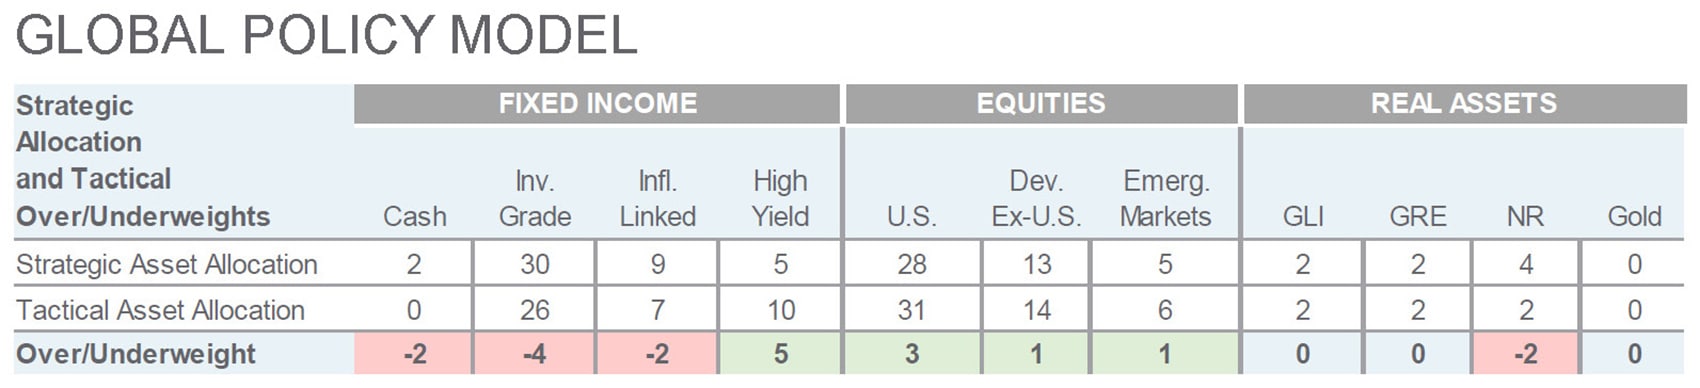
Source: Northern Trust Capital Market Assumptions Working Group, Investment Policy Committee. Strategic allocation is based on capital market return, risk and correlation assumptions developed annually; most recent model released 8/9/2023.The model cannot account for the impact that economic, market and other factors may have on the implementation and ongoing management of an actual investment strategy. Asset allocation does not guarantee a profit or protection against a loss in declining markets. GLI = Global Listed Infrastructure, GRE = Global Real Estate, NR = Natural Resources.
Main Point
Consumer Strength and Strong Job Market Propel Growth
Our analysis examines how robust consumer spending and a strong labor market may propel economic growth. We explore how these factors counteract inflation, providing insights into market stability and future growth prospects.

Contact Us
Interested in learning more about our expertise and how we can help?
Indexes used and definitions:
Bloomberg U.S. Corporate High Yield 2% Issuer Cap Index: Measures the performance of high yield corporate bonds, with a maximum allocation of 2% to any one issuer.
Bloomberg U.S. Credit Index: Measures the investment grade, U.S. dollar-denominated, fixed-rate, taxable corporate and government-related bond markets. It is composed of the U.S. Corporate Index and a non-corporate component that includes non-U.S. agencies, sovereigns, supranationals and local authorities.
Bloomberg Global Aggregate (Agg) Index: Flagship measure of global investment grade debt from a multitude of local currency markets. This multi-currency benchmark includes treasury, government-related corporate and securitized fixed-rate bonds from both developed and emerging markets issuers.
MSCI ACWI: A free-float weighted equity index that includes both emerging and developed world markets.
S&P 500 Index: Widely regarded as the best single gauge of large-cap U.S. equities. The index includes 500 leading companies and covers approximately 80% of available market capitalization.
Unless noted otherwise, data in this piece is Sourced from Bloomberg as of May 2024.
The information contained herein is intended for use with current or prospective clients of Northern Trust Investments, Inc (NTI) or its affiliates. The information is not intended for distribution or use by any person in any jurisdiction where such distribution would be contrary to local law or regulation. NTI or its affiliates may have positions in and may effect transactions in the markets, contracts and related investments different than described in this information. This information is obtained from sources believed to be reliable, its accuracy and completeness are not guaranteed, and is subject to change. Information does not constitute a recommendation of any investment strategy, is not intended as investment advice and does not take into account all the circumstances of each investor.
This report is provided for informational purposes only and is not intended to be, and should not be construed as, an offer, solicitation or recommendation with respect to any transaction and should not be treated as legal advice, investment advice or tax advice. Recipients should not rely upon this information as a substitute for obtaining specific legal or tax advice from their own professional legal or tax advisors. References to specific securities and their issuers are for illustrative purposes only and are not intended and should not be interpreted as recommendations to purchase or sell such securities. Indices and trademarks are the property of their respective owners. Information is subject to change based on market or other conditions.
All securities investing and trading activities risk the loss of capital. Each portfolio is subject to substantial risks including market risks, strategy risks, advisor risk, and risks with respect to its investment in other structures. There can be no assurance that any portfolio investment objectives will be achieved, or that any investment will achieve profits or avoid incurring substantial losses. No investment strategy or risk management technique can guarantee returns or eliminate risk in any market environment. Risk controls and models do not promise any level of performance or guarantee against loss of principal. Any discussion of risk management is intended to describe NTI or its affiliates’ efforts to monitor and manage risk but does not imply low risk.
Past performance is not a guarantee of future results. Performance returns and the principal value of an investment will fluctuate. Performance returns contained herein are subject to revision by NTI or its affiliates. Comparative indices shown are provided as an indication of the performance of a particular segment of the capital markets and/or alternative strategies in general. Index performance returns do not reflect any management fees, transaction costs or expenses. It is not possible to invest directly in any index. Net performance returns are reduced by investment management fees and other expenses relating to the management of the account. Gross performance returns contained herein include reinvestment of dividends and other earnings, transaction costs, and all fees and expenses other than investment management fees, unless indicated otherwise. For additional information on fees, please refer to Part 2a of the Form ADV or consult an NTI representative.
Forward-looking statements and assumptions are NTI or its affiliates’ current estimates or expectations of future events or future results based upon proprietary research and should not be construed as an estimate or promise of results that a portfolio may achieve. Actual results could differ materially from the results indicated by this information.
This information is intended for purposes of NTI and/or its affiliates marketing as providers of the products and services described herein and not to provide any fiduciary investment advice within the meaning of Section 3(21) of the Employee Retirement Income Security Act of 1974, as amended (ERISA). NTI and/or its affiliates are not undertaking to provide impartial investment advice or give advice in a fiduciary capacity to the recipient of these materials, which are for marketing purposes and are not intended to serve as a primary basis for investment decisions. NTI and its affiliates receive fees and other compensation in connection with the products and services described herein as well as for custody, fund administration, transfer agent, investment operations outsourcing, and other services rendered to various proprietary and third-party investment products and firms that may be the subject of or become associated with the services described herein.
Northern Trust Asset Management is composed of Northern Trust Investments, Inc., Northern Trust Global Investments Limited, Northern Trust Fund Managers (Ireland) Limited, Northern Trust Global Investments Japan, K.K., NT Global Advisors, Inc., 50 South Capital Advisors, LLC, Northern Trust Asset Management Australia Pty Ltd, and investment personnel of The Northern Trust Company of Hong Kong Limited and The Northern Trust Company.