High-Yield Bonds: Gaining Traction for Good Reason
Solid fundamentals, low default risk, attractive yields, and strong performance relative to equities make high-yield bonds an effective diversifier.
- High Yield Strategy
- Active Investing
- High Yield Fixed Income Fund
- Portfolio Construction
Key Points
What it is
We believe this asset class is positioned to continue delivering strong performance throughout 2024.
Why it matters
These instruments historically have delivered equity like returns, without equity like volatility, over the full market cycle.
Where it's going
The attraction of high yields and potential for strong total returns, coupled with lower volatility compared to other risk assets, remains significant.
High-yield bonds have become an increasingly popular investment choice, and we strongly believe this asset class is positioned to continue delivering the strong performance seen in the first half of 2024. At Northern Trust Asset Management, we classify high-yield bonds as “the least risky risk asset” because they historically have delivered equity like returns without equity like volatility over the full market cycle thanks in part to their income component. The asset class has grown from $500 billion in 2002 to more than $1.5 trillion today. Inflows of $6.7 billion in May 2024 alone highlight substantial positive sentiment among investors.
Sources: Nasdaq and Bloomberg May 31, 2024
A Compelling Thesis
This favorable trend is rooted in a notable confluence of solid fundamentals, low default risk, and strong performance relative to equities in volatile markets. In addition to their capacity as a yield-producing mainstay, high-yield bonds can help investors optimize portfolio diversification given their resilience during periods of equity decline. The asymmetrical return profile of high yield, when compared to equities (shown below), demonstrates the capture of a considerable portion of positive market gains but only a limited portion of equities’ downside volatility.
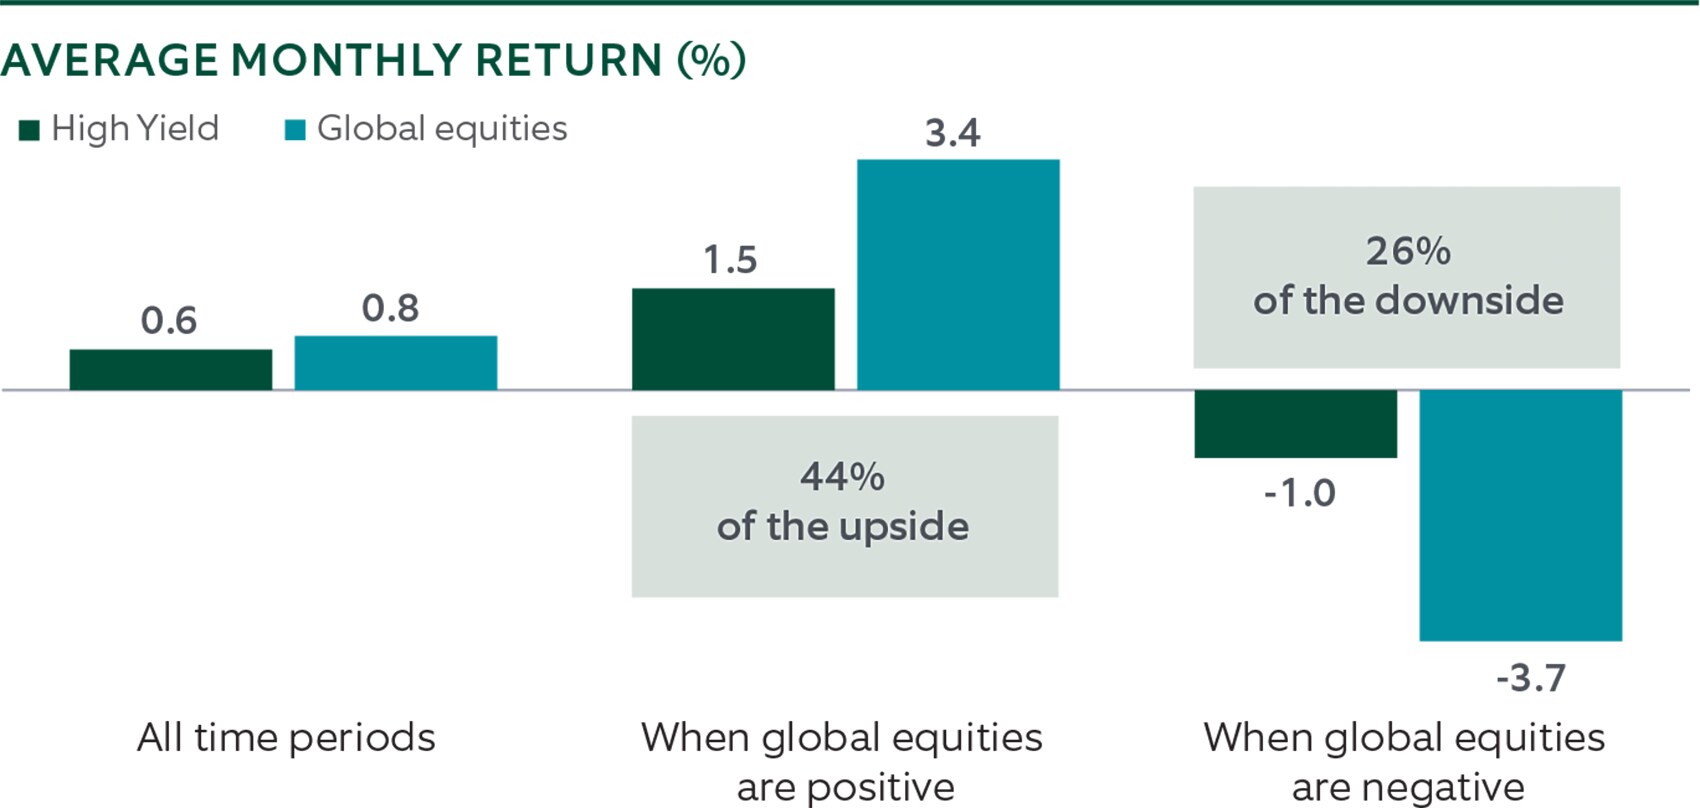
Source: Northern Trust Asset Management, Bloomberg. Left chart: Data from 1/29/1993 to 06/30/2024. Global equities: MSCI ACWI Index; high yield: Bloomberg High Yield 2% Issuer Cap Index. Returns reflect the reinvestment of dividends and other earnings and are shown before the deduction of investment management fees, unless indicated otherwise. Returns of the indexes also do not typically reflect the deduction of investment management fees, trading costs or other expenses. It is not possible to invest directly in an index. Indexes are the property of their respective owners, all rights reserved. Past performance is not indicative or a guarantee of future results.
Strong Fundamentals Fuel Investor Appetite
Today’s high-yield market offers higher credit quality than a decade ago, a consequence of the improved fundamentals which further support the case for a lower expectation of defaults vs historical averages. As of June 30, 2024, more than half of the high-yield market (51%) consisted of BB-rated bonds (up from 41% 10 years ago), with 37% B-rated, and 11% CCC-rated bonds (compared to 41% and 17% respectively 10 years ago. Furthermore, the size of the market, regarding the number of bonds in the high-yield universe, is at an all-time high. As mentioned previously, the US high-yield bond market represents a more than $1.5 trillion market - up from $500 billion in 2002.
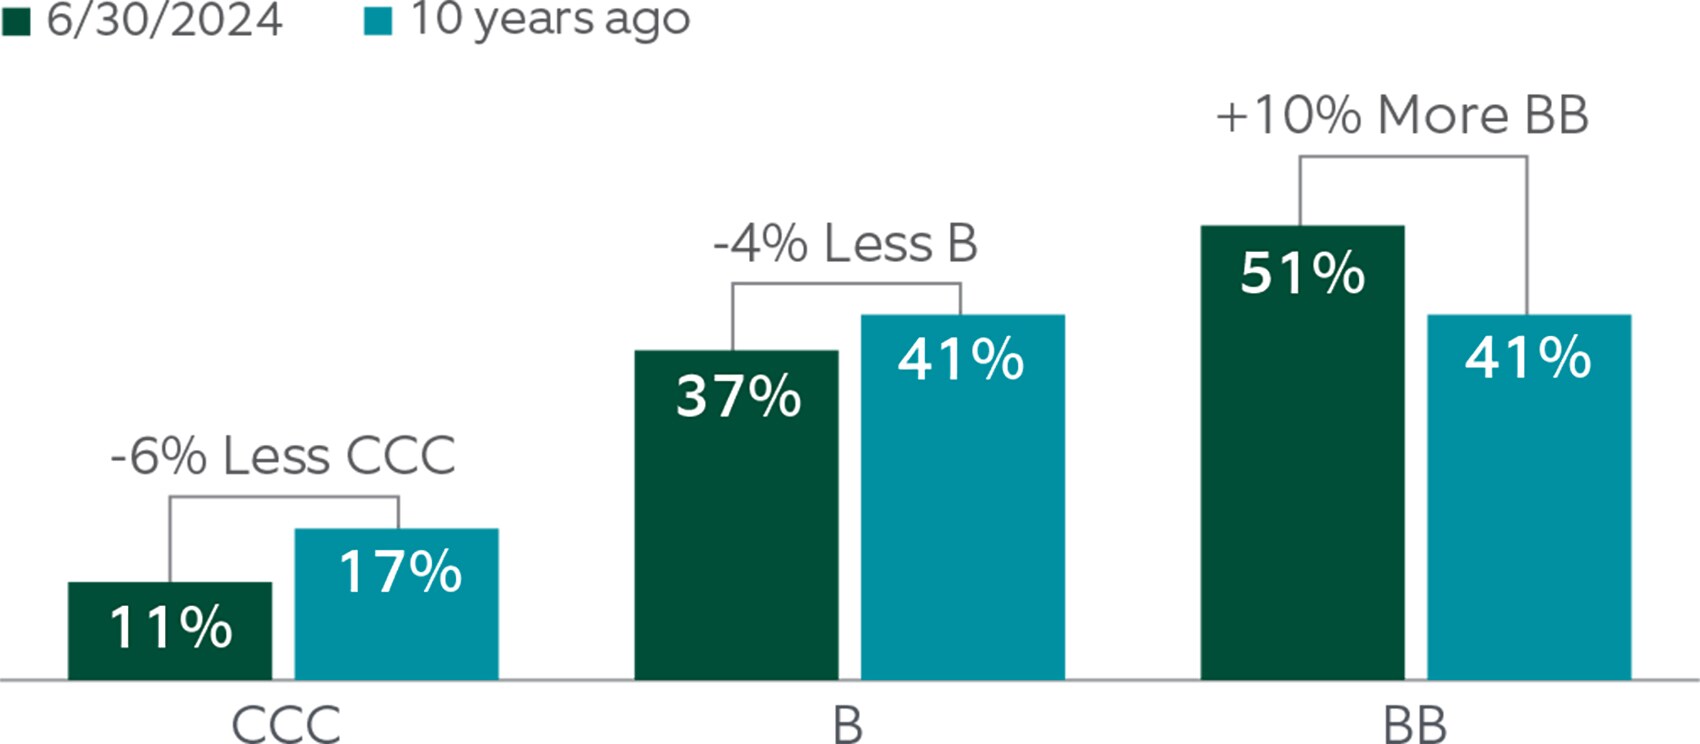
Source: Bloomberg U.S. Corporate High Yield Bond Index (2% Issuer Capped), as of 06/30/2024. “BB”, “B”, and “CCC” represent the ratings subsets of the Index. A security rating is not a recommendation to buy, sell or hold securities. The rating may be subject to revision or withdrawal at any time by the assigning rating organization. Each rating should be evaluated independently of the other ratings. The highest rating noted is “BB” and the lowest is “CCC.” Past performance is not indicative or a guarantee of future results. Index performance returns do not reflect any management fees, transaction costs or expenses. It is not possible to invest directly in any index. Indexes are the property of their respective owners, all rights reserved.
The Portion of the Market in Distress is Low
While rates on high-yield bonds are high, we expect default rates to be low. Some investors, particularly those who may be new to the high-yield space, may assume that a high interest rate would lead to much higher default rates. This is not the case. As a consequence of these strong fundamentals and strong corporate balance sheets, the high-yield market’s default outlook is notably benign. Eric Williams, portfolio manager and head of capital structure, global fixed income at Northern Trust Asset Management says: "Treasurers continue to make tremendous progress in pushing out their maturity profile, thereby reducing near-term risks. In general, markets are open for most companies, and as a result, distress remains low, which translates into limited prospects for an increased future default rate."
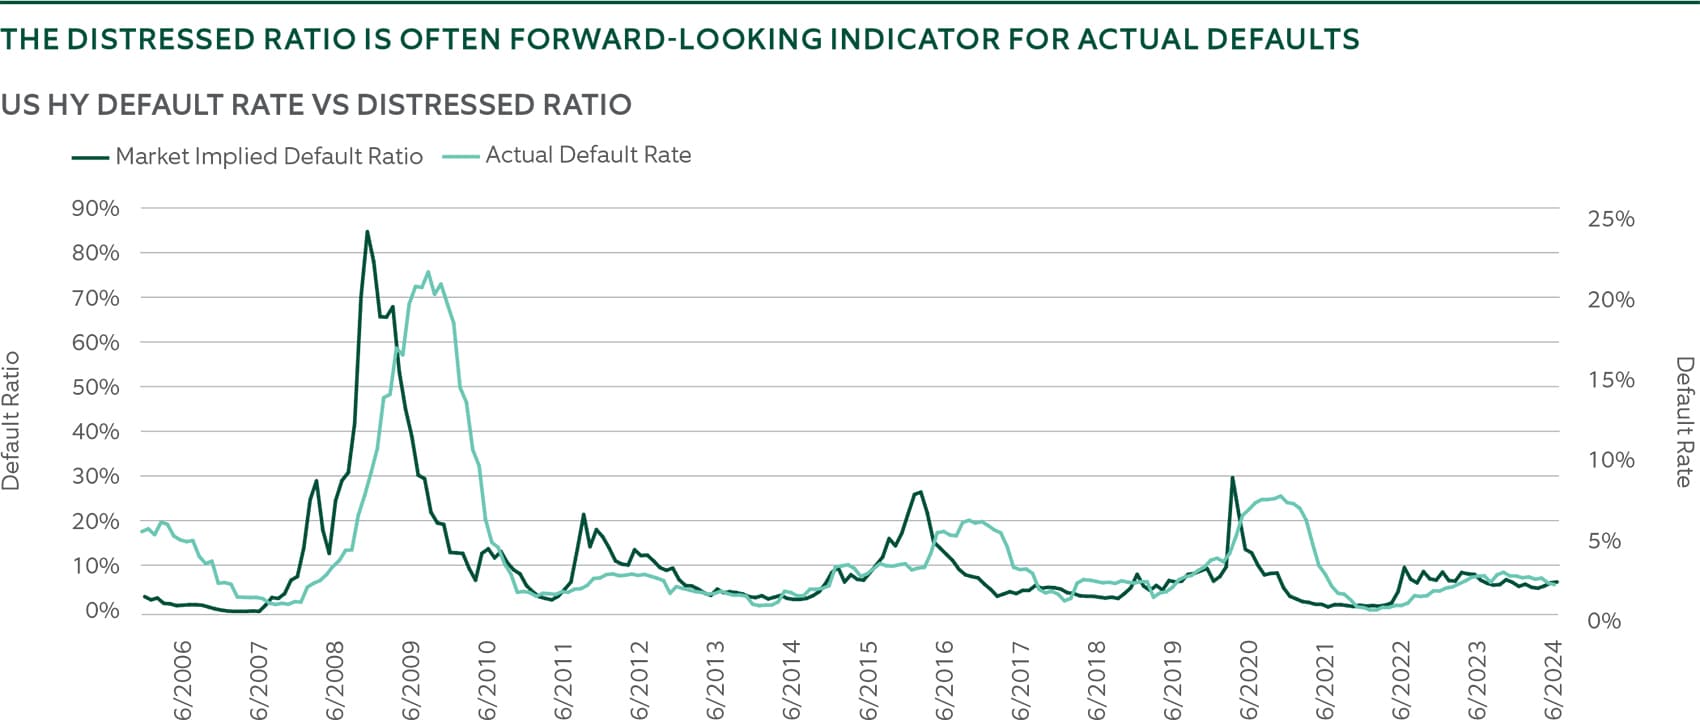
Source: Bank of America Global Research. High Yield (HY) distress is defined as spreads > 1,000 basis points. Default Rate, trailing-12 months. US HY: High Yield rated USD bonds from US corporate issuers. Data as of 6/30/24. Historical trends are not indicative of future results.
Further to this supportive environment of low default rates and opportunity for volatility in equity markets, we believe high yield presents a compelling case for strong for those investors able to allocate. Williams, adds:
" have exhibited a very low level of volatility on a year to date basis and frankly reside at the tighter end of the spread range over the last couple of years. At the aggregate level, many investors may be curious as to the opportunity set available to them with hovering around 300 . Given the outperformance of the asset class relative to other assets, it is clear that the consistent income generation that it affords is a major influence on investors. Currently the is north of 8% and there is a 10-point — both have been overriding factors in investors’ decisions to allocate to the asset class."
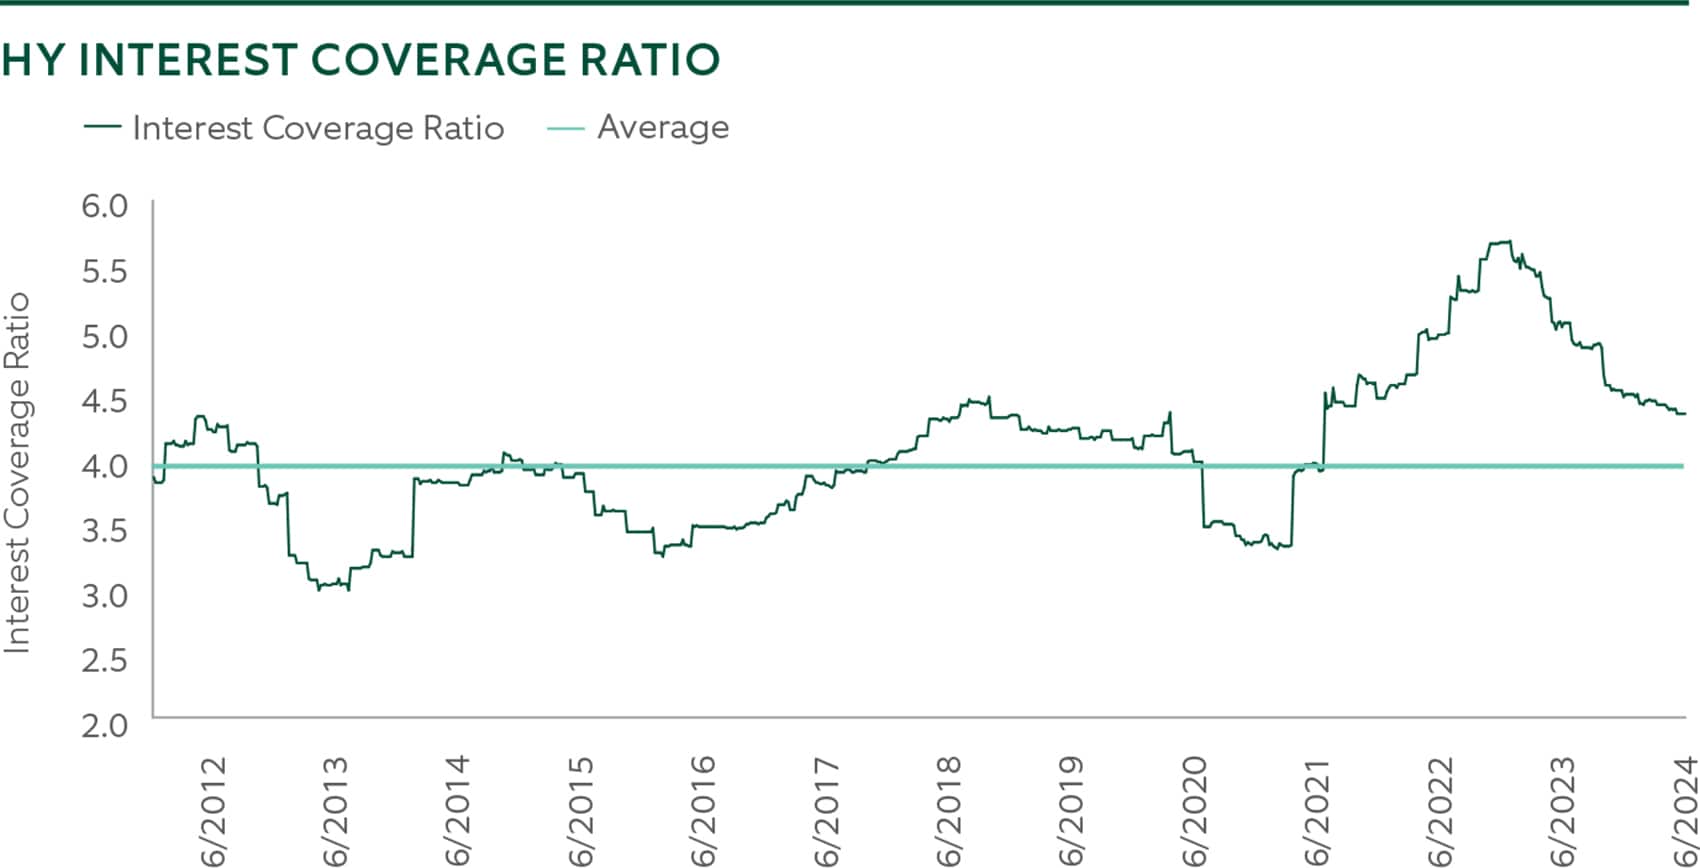
Higher Interest Coverage & Lower Leverage in the High-Yield Market
* remain strong thanks to stronger earnings that look set to continue (5-5.75% in 2023), with remaining well below historic peaks since 2011. Only 12% of the high-yield universe has debt maturing in the next two years. "Approximately 40% of debt maturing between 2024 and 2026 has been refinanced over the last year," says Williams. "This has been the most rapid debt extension in history, providing attractive opportunities for investors to capture potential returns."
A measure of the lowest possible yield that can be received on a bond with an early retirement provision.
A basis point is 1/100th of 1%, or 0.01%. Basis points often are used to quantify interest rates, bond yields and investment returns.
The ratio of earnings to interest expenses is an indicator of the ability of a company to make interest payments on debt.
Leverage results from using borrowed capital as a source of funding when investing to expand a firm's asset base and generate returns on risk capital.
Par value is a benchmark for pricing bonds. Whenever the price of the bond is set below the par value, the bond is deemed to be “discounted” or trading at a discount; when the price of the bond is above the par value, the bond is considered to be trading at a premium.
The return on an investment adjusted for the level of risk taken.
A high yield spread is the normally positive difference between the yield of a high yield bond and the yield of a benchmark bond, such as a Treasury bond of similar maturity.
The amount a borrower pays in basis points over a benchmark bond measure, for each dollar drawn down.
"Approximately 40% of debt maturing between 2024 and 2026 has been refinanced over the last year. This has been the most rapid debt extension in history, providing attractive opportunities for investors to capture potential returns."
Source: Bank of America Global Research.
*Interest Coverage Ratio is the ratio of earnings to interest expenses is an indicator of the ability of a company to make interest payments on debt. Data from 12/31/2011 to 06/30/2024.
Sticky Inflation and a Data Dependent Fed
The Federal Reserve ("the Fed") recently noted that its effort to curb inflation is making incremental progress but opted to hold rates at its June meeting. At Northern Trust, we are aligned with the market view and expect two rate cuts by the end of 2024, further supporting the attractiveness of high-yield investments. Anwiti Bahuguna, NTAM’s CIO of global asset allocation notes, "The market has been pricing out expectations of several rate cuts throughout the year as inflation has been sticky. If inflation does not show meaningful signs of falling, we could even see its resurgence, essentially pricing out the two expected cuts. In this scenario, the economic growth we expect might not be enough to balance higher rates. This of course has implications for stock markets and risk assets," she adds.
S&P earnings in 2024 are expected to surpass the average growth rate of the past decade. Bahuguna says, “Earnings expectations are now following the path of United States growth. Consensus now expects S&P earnings to be up 11% this year. It is our view that growth will not only be solid, but it may actually exceed that consensus.”
The era of ultra- low interest rates which, coupled with improved fiscal responsibility, allowed corporate bond issuers to shore up their balance sheets. As a result, their ability to cover interest with earnings is strong, and debt accumulation by companies is restrained, potentially helping to avoid defaults or mitigate losses if default does occur. The markets are welcoming for issuers looking to term out their debt, and there is little near-term need for refinancing by the more vulnerable issuers. Meanwhile, strong U.S. nominal growth supports a stable economic backdrop, allowing investors to explore opportunities with strategic security selection and practical portfolio construction.
The conditions described above make a compelling case for including a high-yield allocation in investor portfolios. The attraction of high yields and potential for strong total returns, coupled with lower volatility compared to other risk assets, remains significant.
Main Point
Re-discover the "least risky risk asset"
Strong fundamentals and a supportive environment combine to make a compelling case for including a high-yield allocation in investor portfolios. The attraction of high yields and potential for strong total returns, coupled with lower volatility compared to other risk assets, remains significant.
Related Products
High Yield Fixed Income Fund
The Fund seeks to generate high current income and the potential for capital appreciation by investing in high-yielding corporate securities while managing portfolio risk.
FlexShares High Yield Value-Scored Bond Index Fund
The Fund seeks investment results that correspond generally to the price and yield performance, before fees and expenses, of the Northern Trust High Yield Value-Scored US Corporate Bond Index (the Underlying Index).
Contact Us
Interested in learning more about our expertise and how we can help?
The Bloomberg U.S. Corporate High Yield Bond Index measures the USD-denominated, high yield, fixed-rate corporate bond market. Securities are classified as high yield if the middle rating of Moody’s, Fitch and S&P is Ba1/BB+/BB+ or below. Bonds from issuers with an emerging markets country of risk, based on the indices’ EM country definition, are excluded. The U.S. Corporate High Yield Index is a component of the U.S. Universal and Global High Yield Indices. The index was created in 1998, with history backfilled to July 1, 1983.
MSCI All Country World Index (MSCI ACWI) is a stock index that tracks nearly 3,000 stocks in 48 developed and emerging market countries. It is not possible to invest directly in an index.
IMPORTANT INFORMATION
Northern Trust Asset Management (NTAM) is composed of Northern Trust Investments, Inc., Northern Trust Global Investments Limited, Northern Trust Fund Managers (Ireland) Limited, Northern Trust Global Investments Japan, K.K., NT Global Advisors, Inc., 50 South Capital Advisors, LLC, Northern Trust Asset Management Australia Pty Ltd, and investment personnel of The Northern Trust Company of Hong Kong Limited and The Northern Trust Company.
Issued in the United Kingdom by Northern Trust Global Investments Limited, issued in the European Economic Association (“EEA”) by Northern Trust Fund Managers (Ireland) Limited, issued in Australia by Northern Trust Asset Management (Australia) Limited (ACN 648 476 019) which holds an Australian Financial Services Licence (License Number: 529895) and is regulated by the Australian Securities and Investments Commission (ASIC), and issued in Hong Kong by The Northern Trust Company of Hong Kong Limited which is regulated by the Hong Kong Securities and Futures Commission.
For Asia-Pacific (APAC) and Europe, Middle East and Africa (EMEA) markets, this information is directed to institutional, professional and wholesale clients or investors only and should not be relied upon by retail clients or investors. This information may not be edited, altered, revised, paraphrased, or otherwise modified without the prior written permission of NTAM. The information is not intended for distribution or use by any person in any jurisdiction where such distribution would be contrary to local law or regulation. NTAM may have positions in and may effect transactions in the markets, contracts and related investments different than described in this information. This information is obtained from sources believed to be reliable, its accuracy and completeness are not guaranteed, and is subject to change. Information does not constitute a recommendation of any investment strategy, is not intended as investment advice and does not take into account all the circumstances of each investor.
This report is provided for informational purposes only and is not intended to be, and should not be construed as, an offer, solicitation or recommendation with respect to any transaction and should not be treated as legal advice, investment advice or tax advice. Recipients should not rely upon this information as a substitute for obtaining specific legal or tax advice from their own professional legal or tax advisors. References to specific securities and their issuers are for illustrative purposes only and are not intended and should not be interpreted as recommendations to purchase or sell such securities. Indices and trademarks are the property of their respective owners. Information is subject to change based on market or other conditions.
All securities investing and trading activities risk the loss of capital. Each portfolio is subject to substantial risks including market risks, strategy risks, advisor risk, and risks with respect to its investment in other structures. There can be no assurance that any portfolio investment objectives will be achieved, or that any investment will achieve profits or avoid incurring substantial losses. No investment strategy or risk management technique can guarantee returns or eliminate risk in any market environment. Risk controls and models do not promise any level of performance or guarantee against loss of principal. Any discussion of risk management is intended to describe NTAM’s efforts to monitor and manage risk but does not imply low risk.
Past performance is not a guarantee of future results. Performance returns and the principal value of an investment will fluctuate. Performance returns contained herein are subject to revision by NTAM. Comparative indices shown are provided as an indication of the performance of a particular segment of the capital markets and/or alternative strategies in general. Index performance returns do not reflect any management fees, transaction costs or expenses. It is not possible to invest directly in any index. Net performance returns are reduced by investment management fees and other expenses relating to the management of the account. Gross performance returns contained herein include reinvestment of dividends and other earnings, transaction costs, and all fees and expenses other than investment management fees, unless indicated otherwise. For U.S. NTI prospects or clients, please refer to Part 2a of the Form ADV or consult an NTI representative for additional information on fees.
Forward-looking statements and assumptions are NTAM’s current estimates or expectations of future events or future results based upon proprietary research and should not be construed as an estimate or promise of results that a portfolio may achieve. Actual results could differ materially from the results indicated by this information.
Before investing, carefully consider the Northern Funds or FlexShares investment objectives, risks, charges, and expenses. This and other information is in the prospectus and a summary prospectus, copies of which may be obtained by visiting ntam.northerntrust.com and/or www.flexshares.com. Read the prospectus carefully before you invest.
Northern Funds are distributed by Northern Funds Distributors, LLC. FlexShares ETFs are distributed by Foreside Fund Services, LLC. Neither Northern Funds Distributors, LLC or Foreside Fund Services, LLC are affiliated with Northern Trust.
© 2024 Northern Trust Corporation. Head Office: 50 South La Salle Street, Chicago, Illinois 60603 U.S.A.